In this step, you will:
Have a look at the connection that you created and observe the data traffic.
In this step, you will:
Have a look at the connection that you created and observe the data traffic.
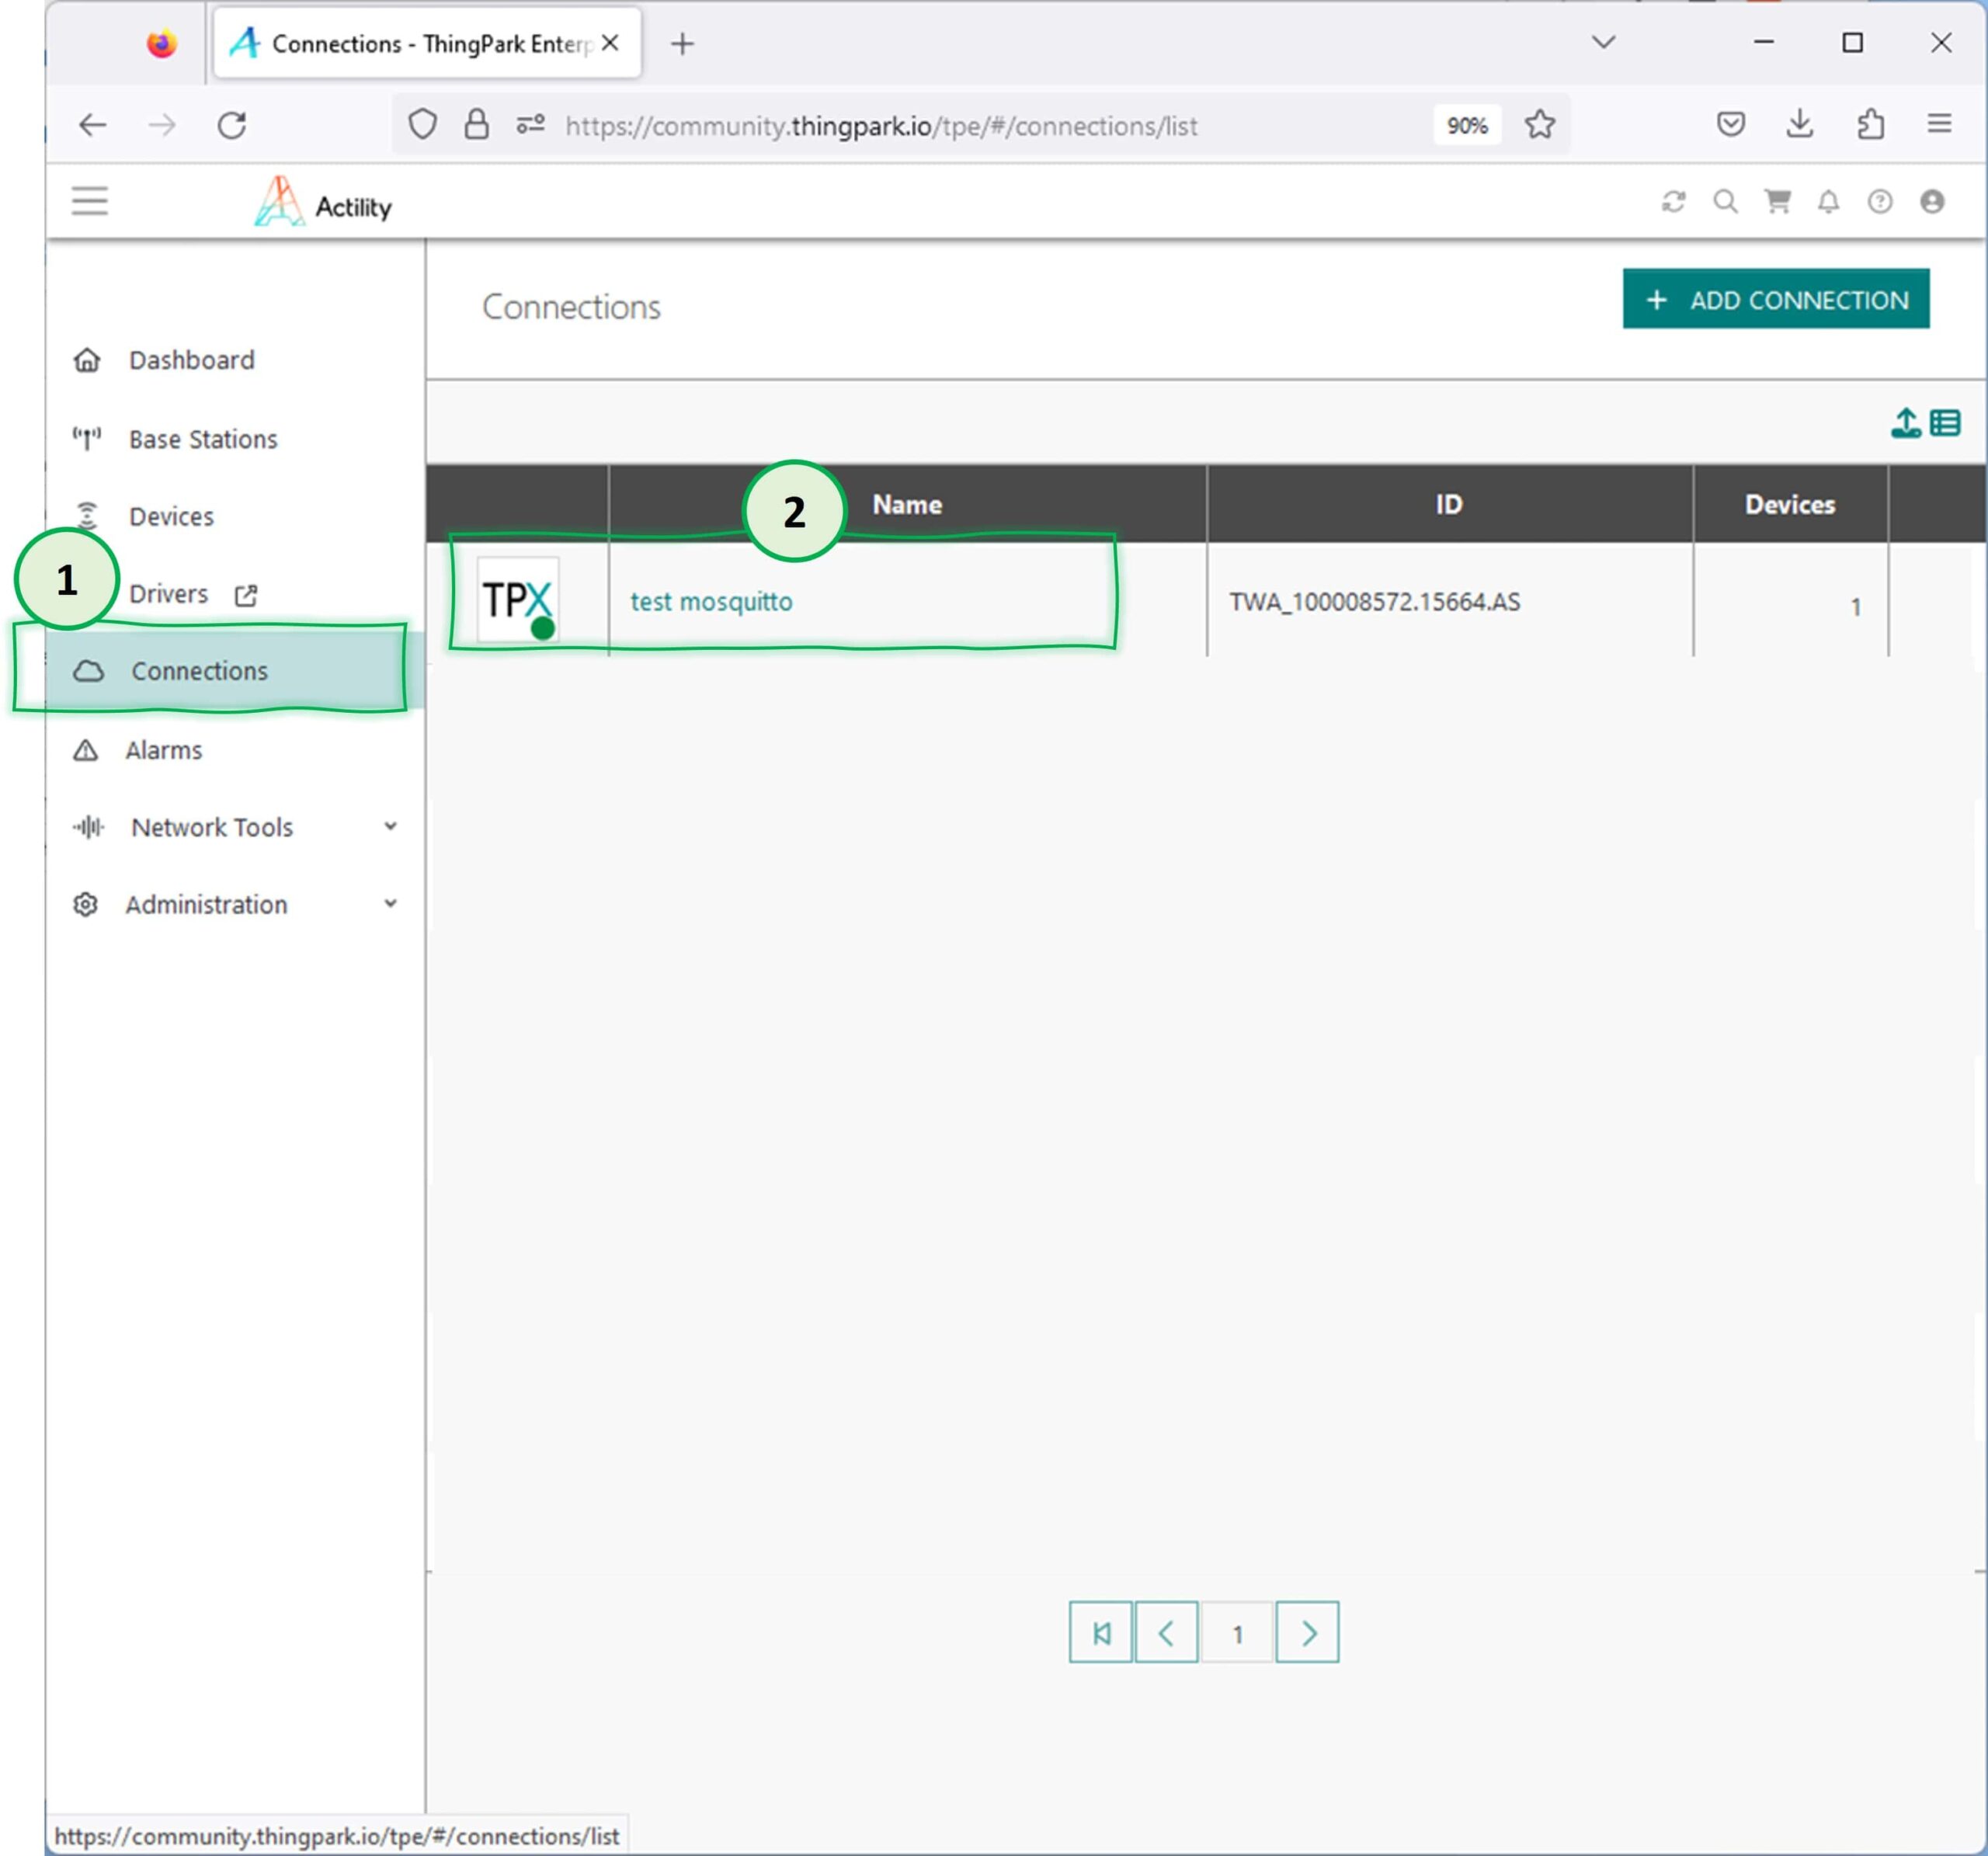
You are able to see the received packets (uplinks) from the device on TPX, as well as observe the condition of the connection to the SCADA platform via the Mosquitto server. You can access TPX screens from your TPC account page.
Click to Connections icon to access connection list and actions
Select test mosquitto from the list.
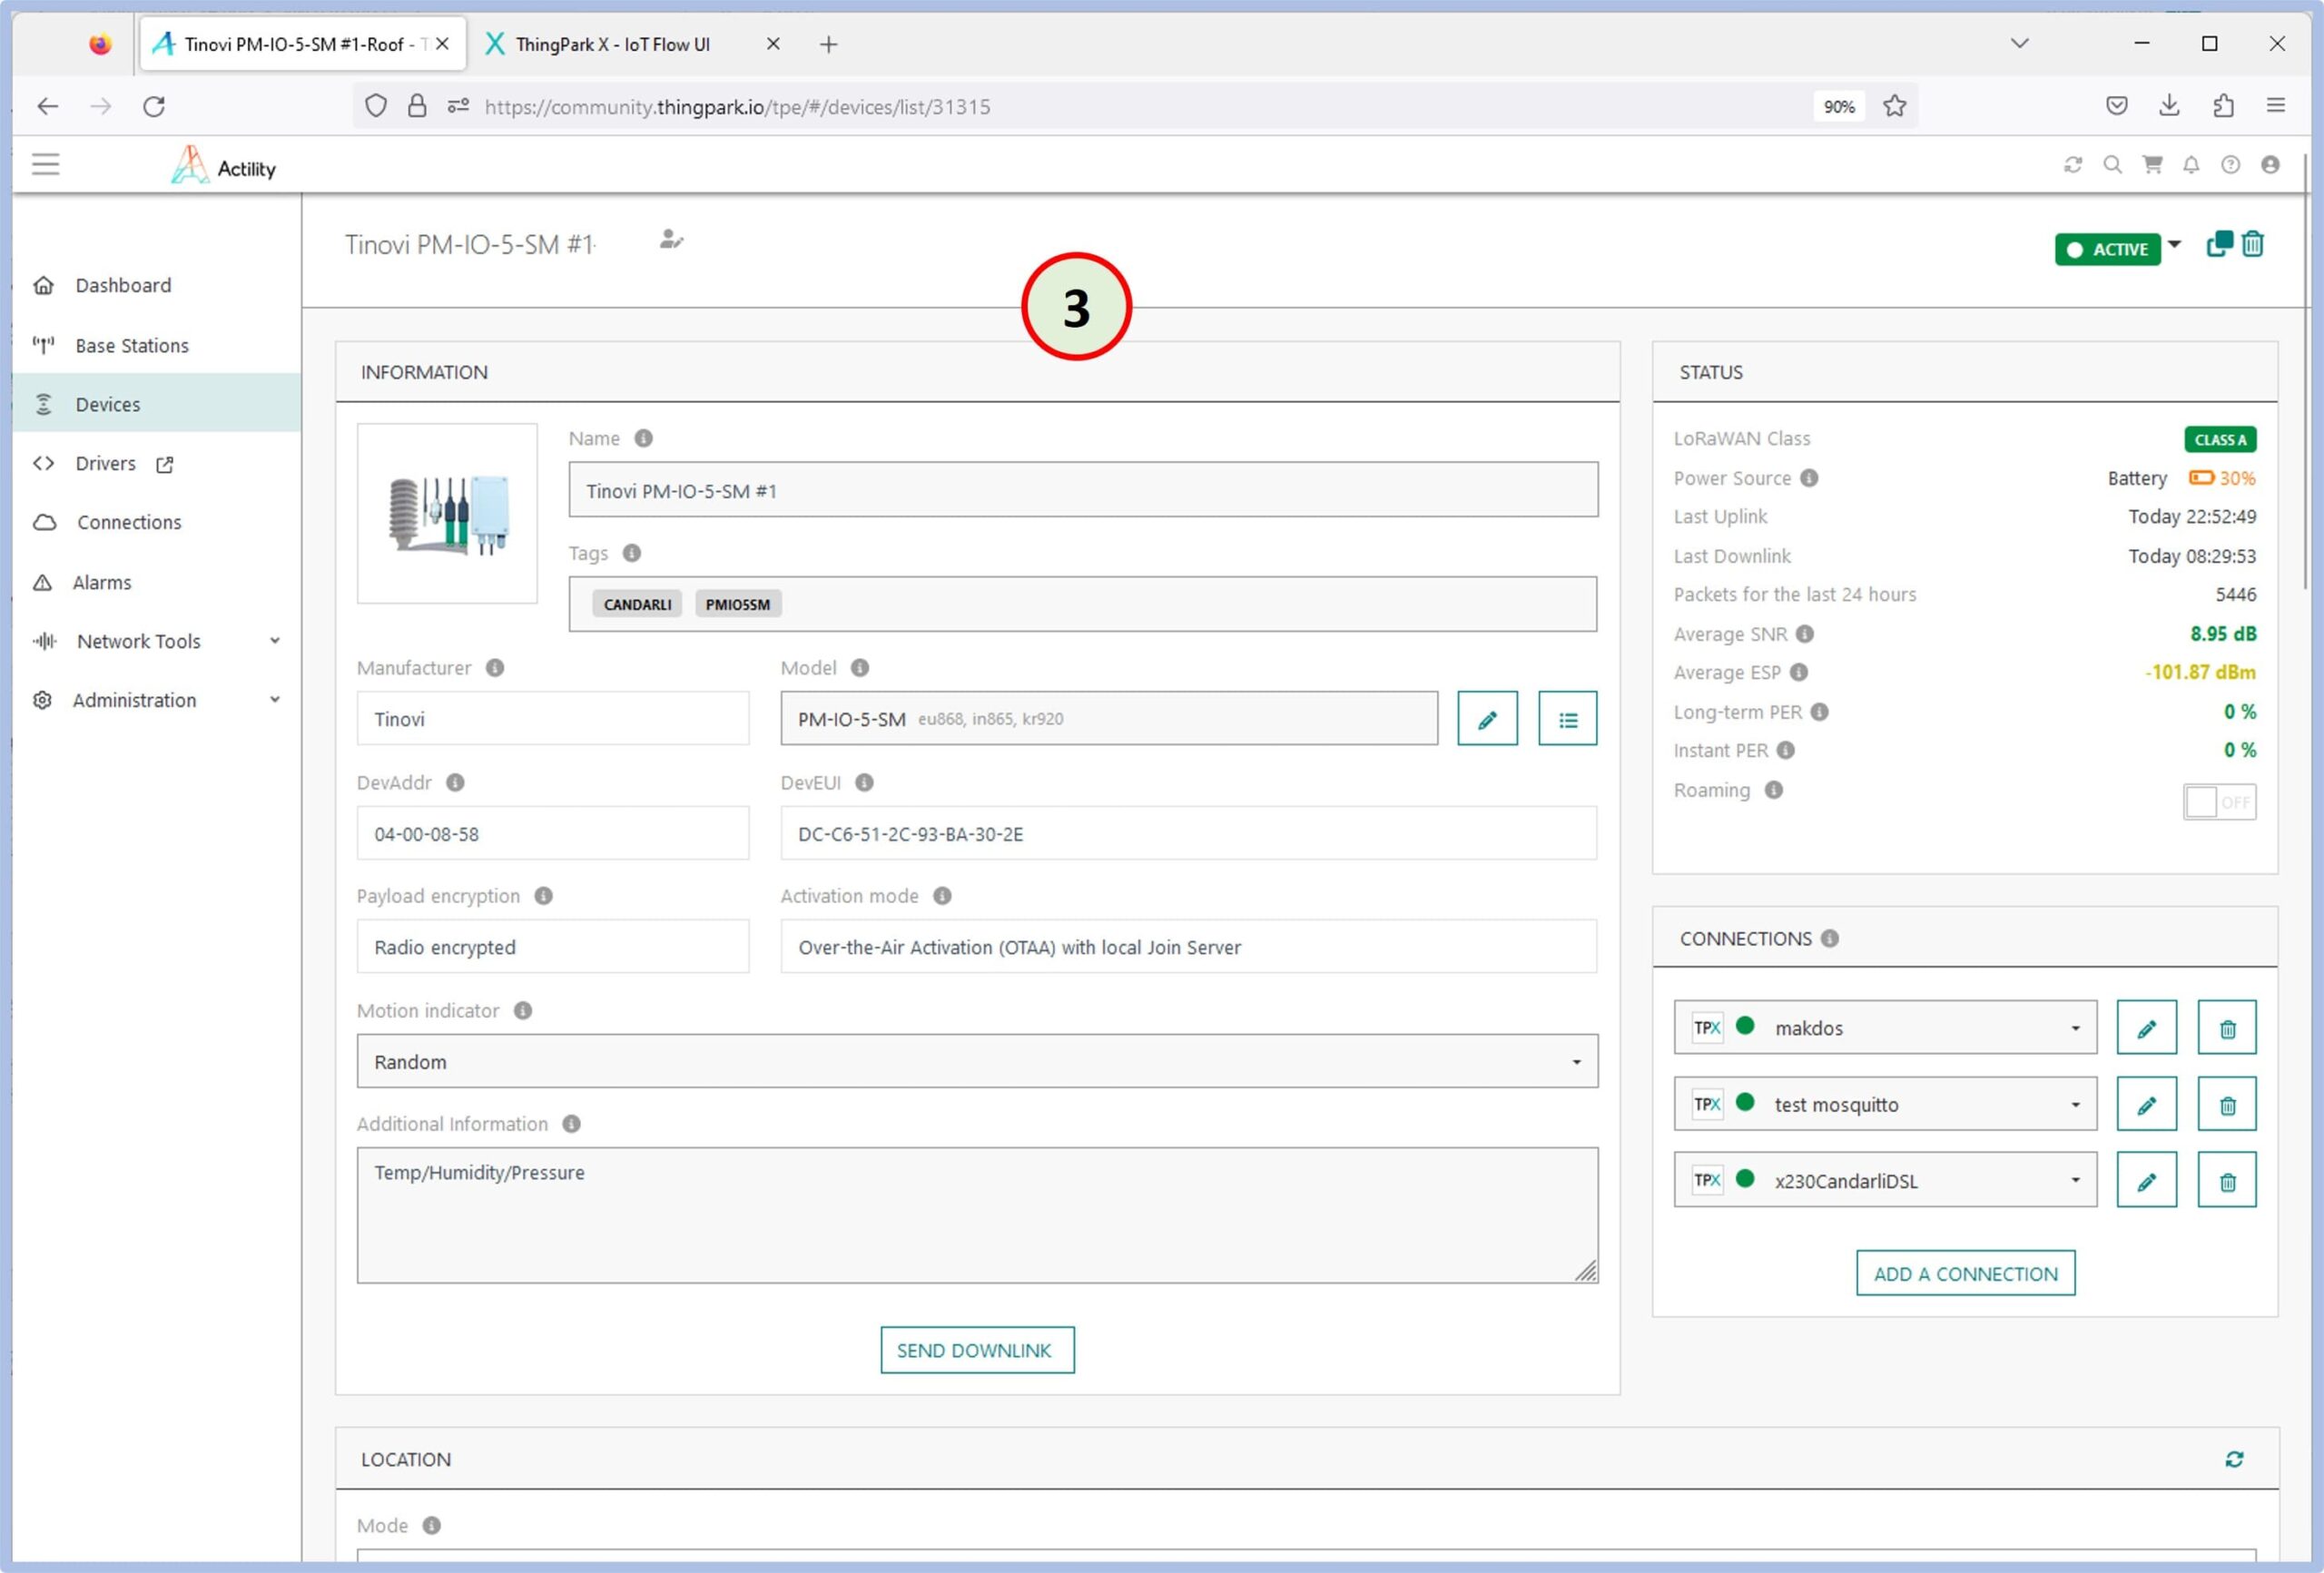
You can view the status of the connection.
You can view the statistics of the connection.
Please be aware that even if the uplink number previously showed ‘0’, it should now display a number greater than ‘0’. This change indicates that your LoRaWAN® device has begun using this connection since you set up your device definition with the connection details.