In this step, you will:
View the received data (MQTT messages) at the Rapid SCADA Administration application.
In this step, you will:
View the received data (MQTT messages) at the Rapid SCADA Administration application.
Before beginning with the SCADA application reports, it is a good idea to double-check the definitions and the environment.
Now, you can view the definition in the Administrator application.
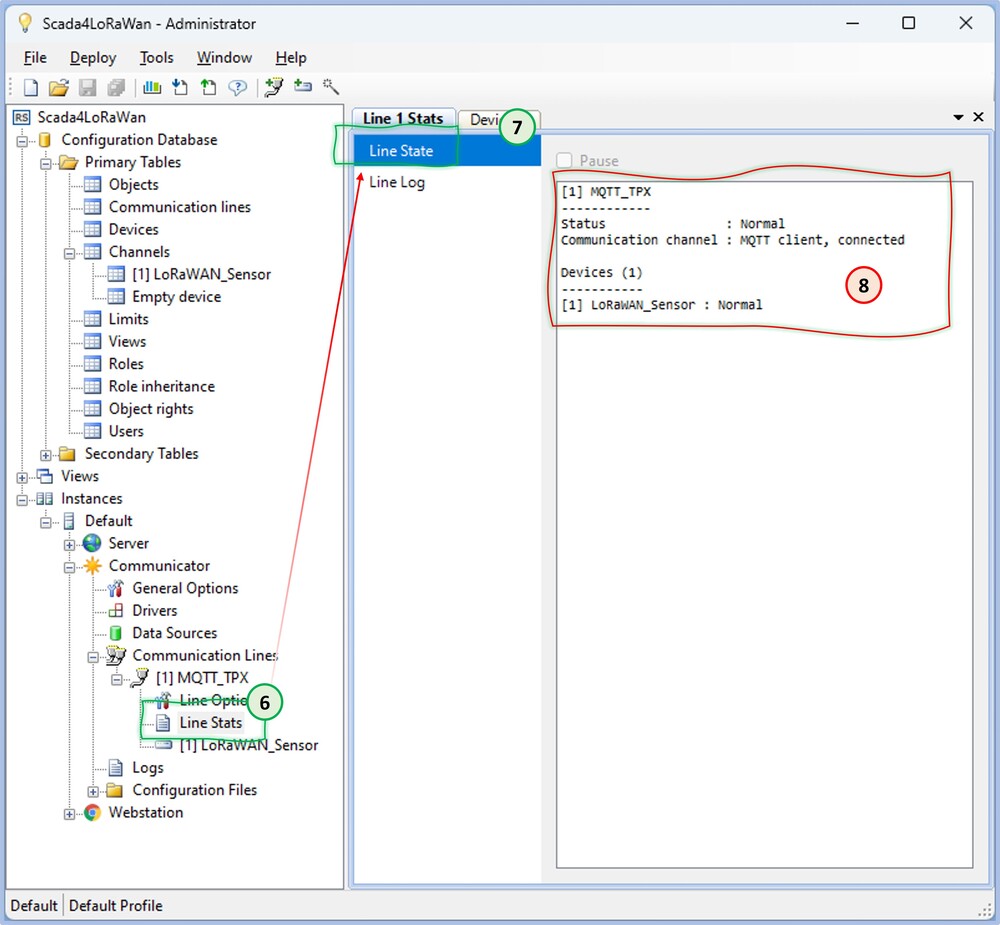
Communication Line: MQTT_TPX
The Device: LoRaWAN®_Sensor
In this panel, you can view the operation status of the Rapid SCADA to verify the definition.
Line Stats: show the status of the MQTT Server connection and the log file content of the connection.
LoRaWAN®_Sensor: show the tags and received values.
so that you can verify the connection status and received data.
Click on the LoRaWAN®_Sensor entry to access the status of the device that represents your LoRaWAN® device.
You can view the Driver name and channel status.
This section shows the number of data packets received from the channel.
You can view the last valid data received by Rapid SCADA. By the way,
TAG = Code
Please notice that Channel column is empty for now. which means that you can’t use these values in reports until you assign them to channels. You are going to make the necessary definitions at the next step (i.e., create channel definitions).
Click on Line Stats to view the options on the right part of the screen.
Click on Line State to view the state of the line.
If you notice that the status of the line between Rapid SCADA and the MQTT Server is Normal and the device that represents your LoRaWAN® sensor is also Normal.
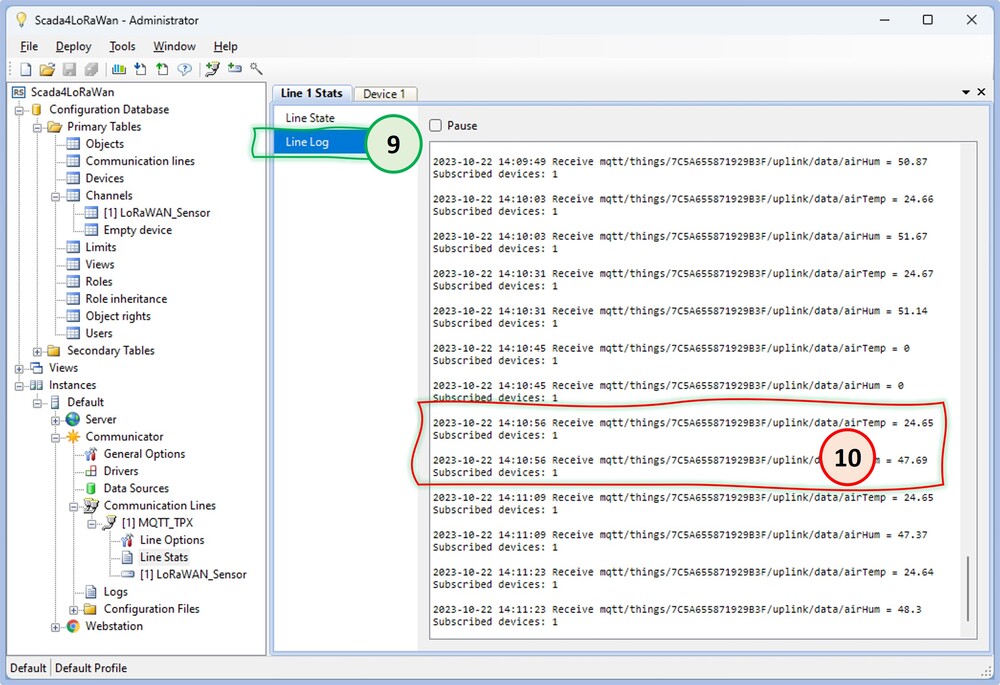
Click on Line Log to view the log of the line, which shows the information exchange on the line between Rapid SCADA and TPC.
You can view the data collected from MQTT Server, which was published by TPC.