In this activity, you performed all the basic steps to visualize the collected sensor data without any programming skills, using:
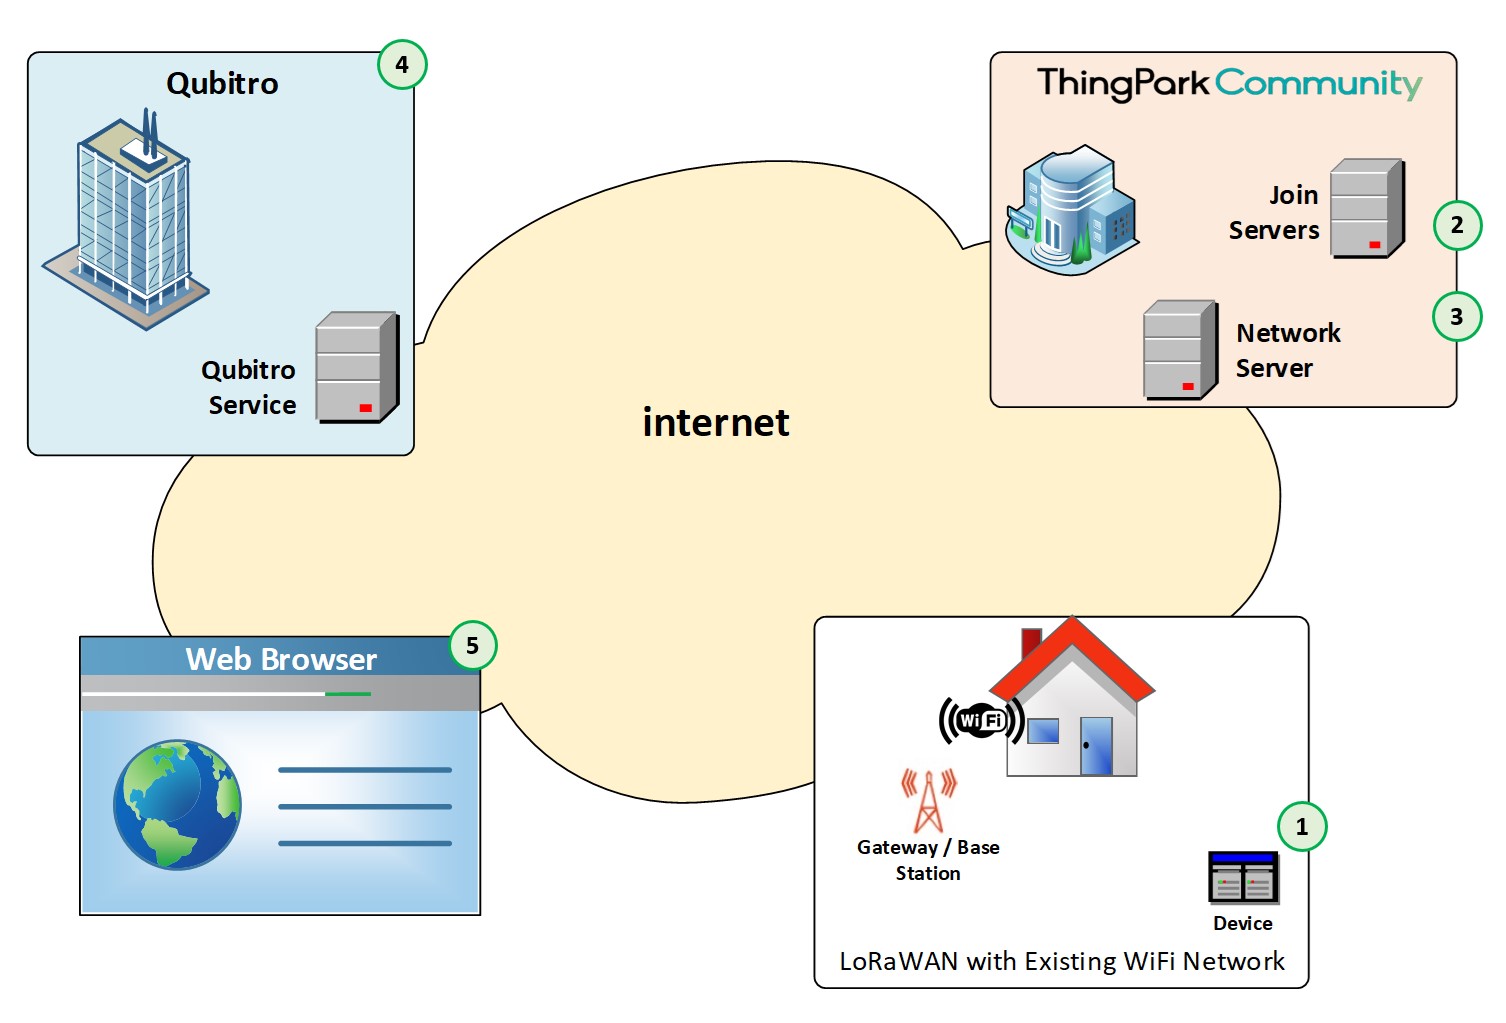
1
A LoRaWAN® device with temperature, air pressure and light sensors to collect data.2
TPC to collect the data from the sensor device.3
TPX device driver and TPX Qubitro Connector to parse and divert collected data to the application platform.4
Qubitro application platform to prepare the dashboard that can be accessed by a web browser.5
Web browser to visualize the collected sensor data.