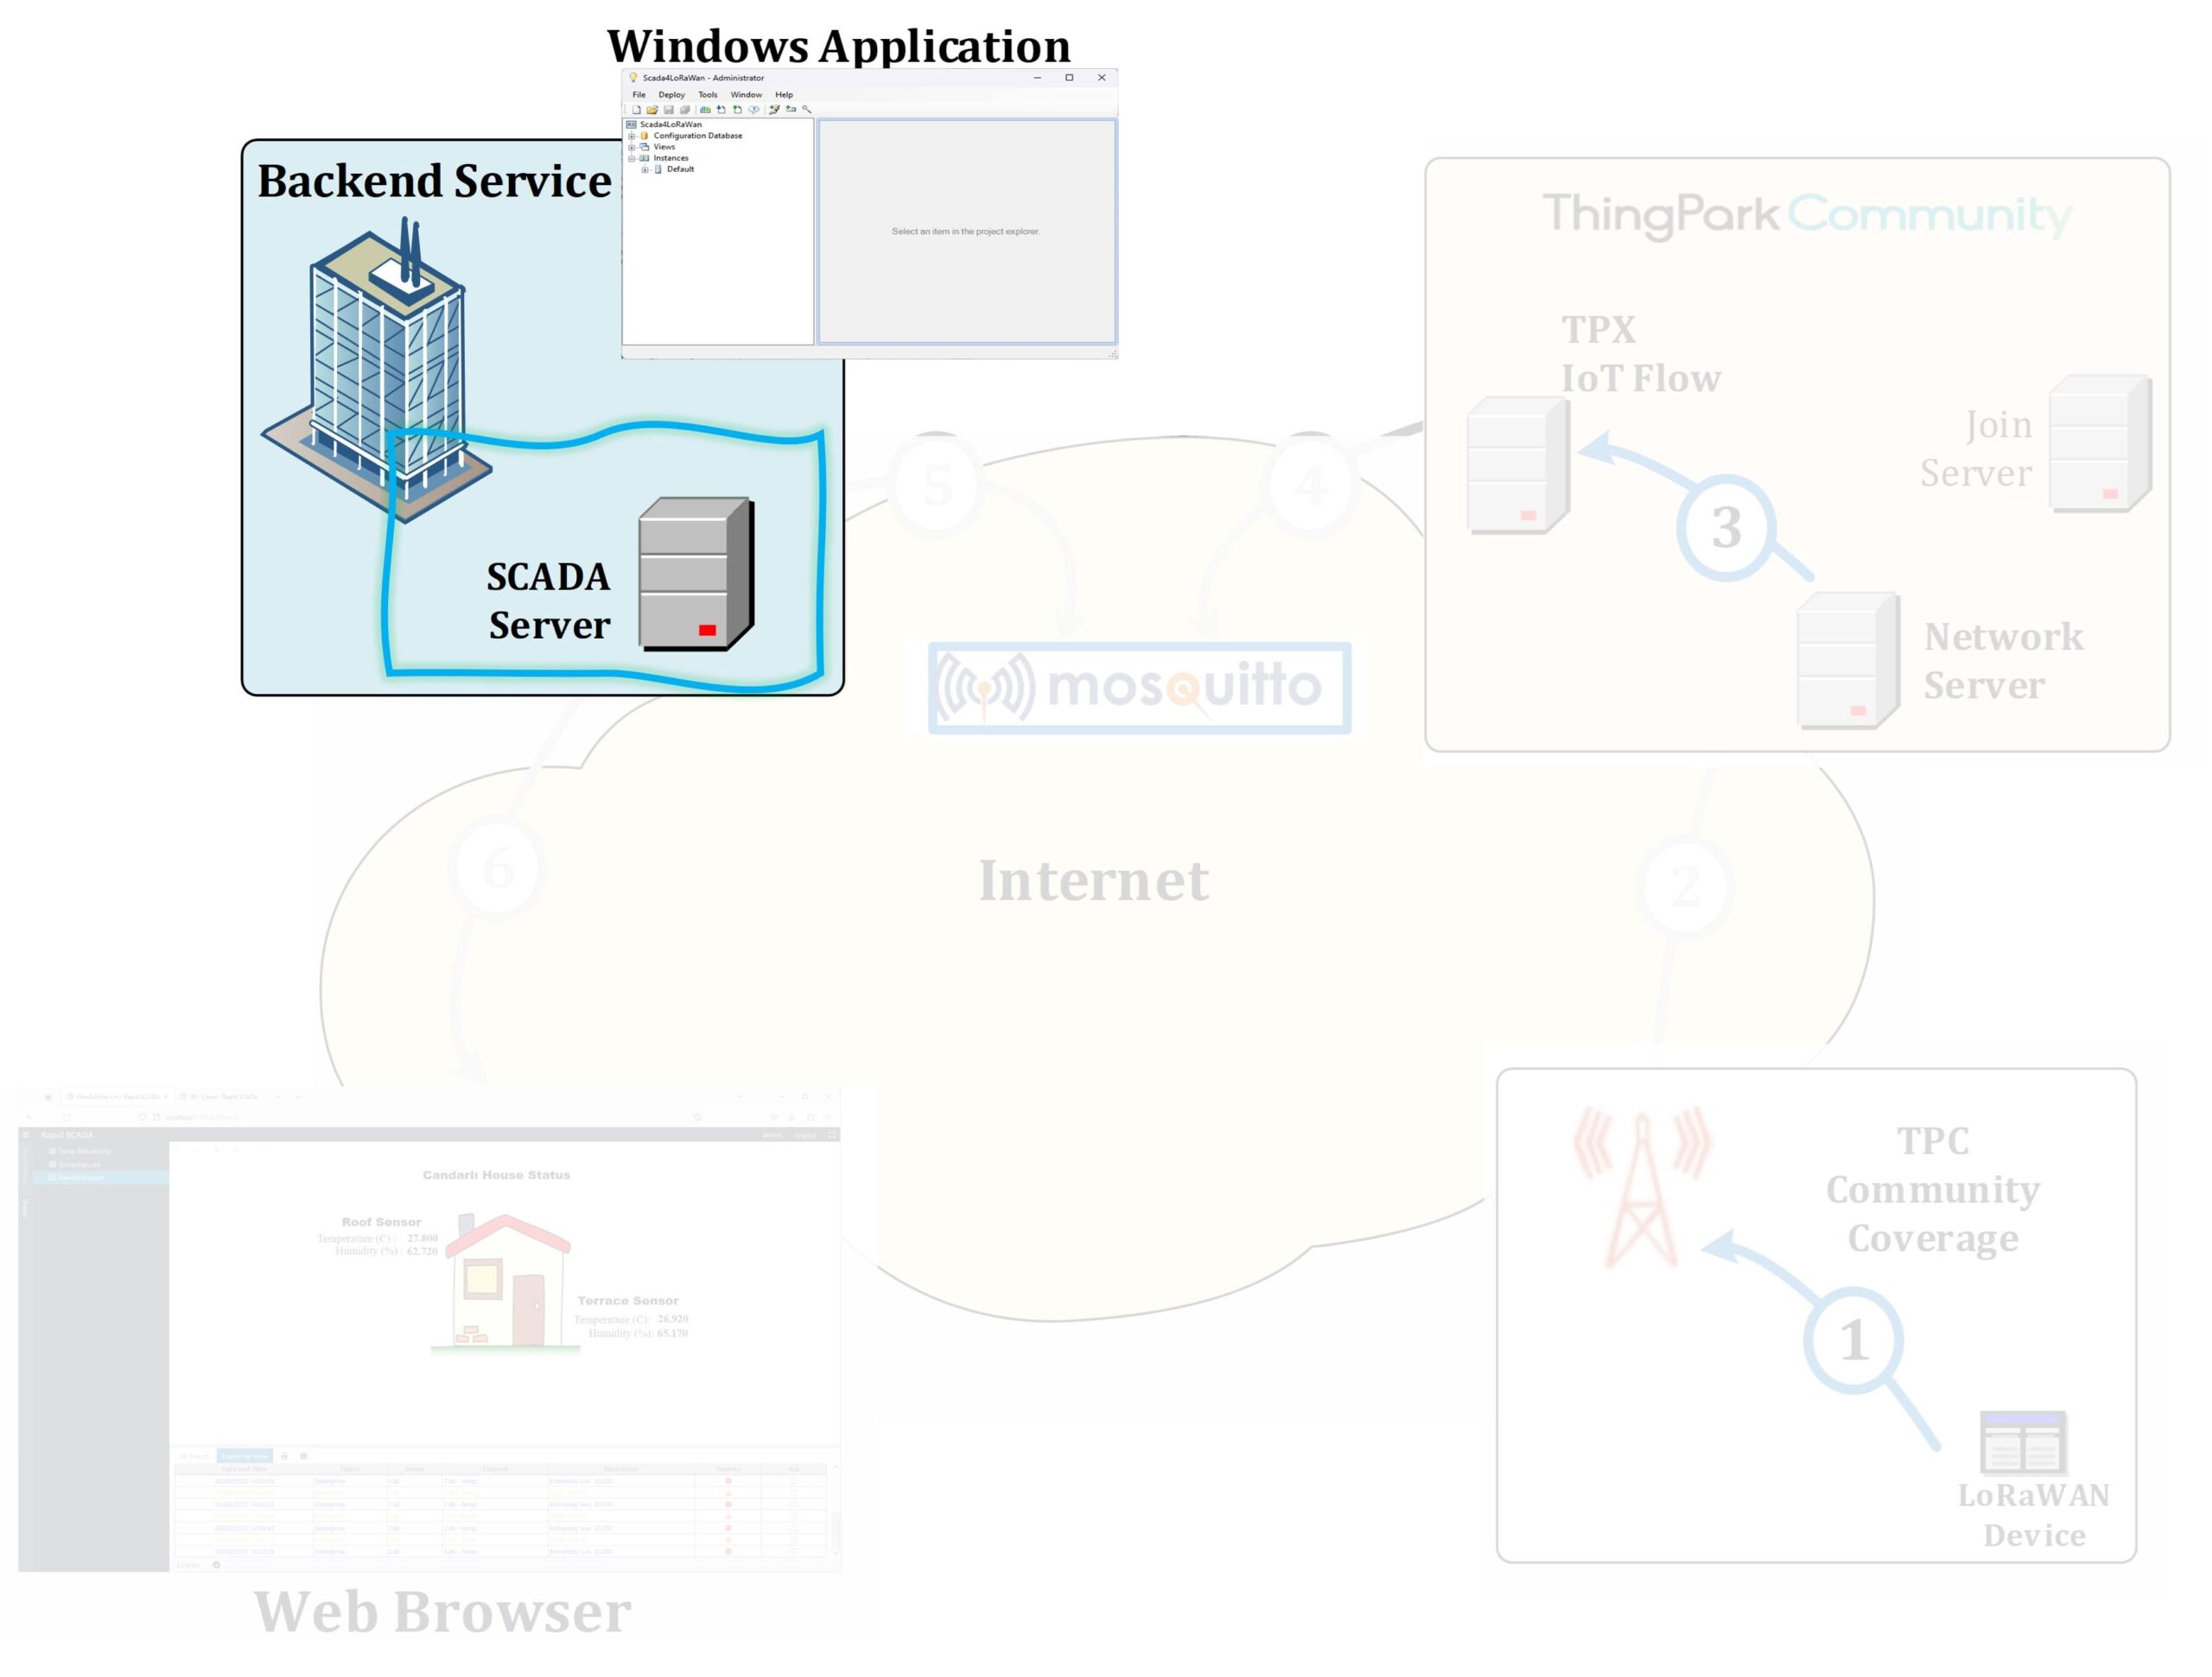
In this step, you will:
Create a report to show in the web browser the data published by TPX.
In this step, you will:
Create a report to show in the web browser the data published by TPX.
In this step, you will:
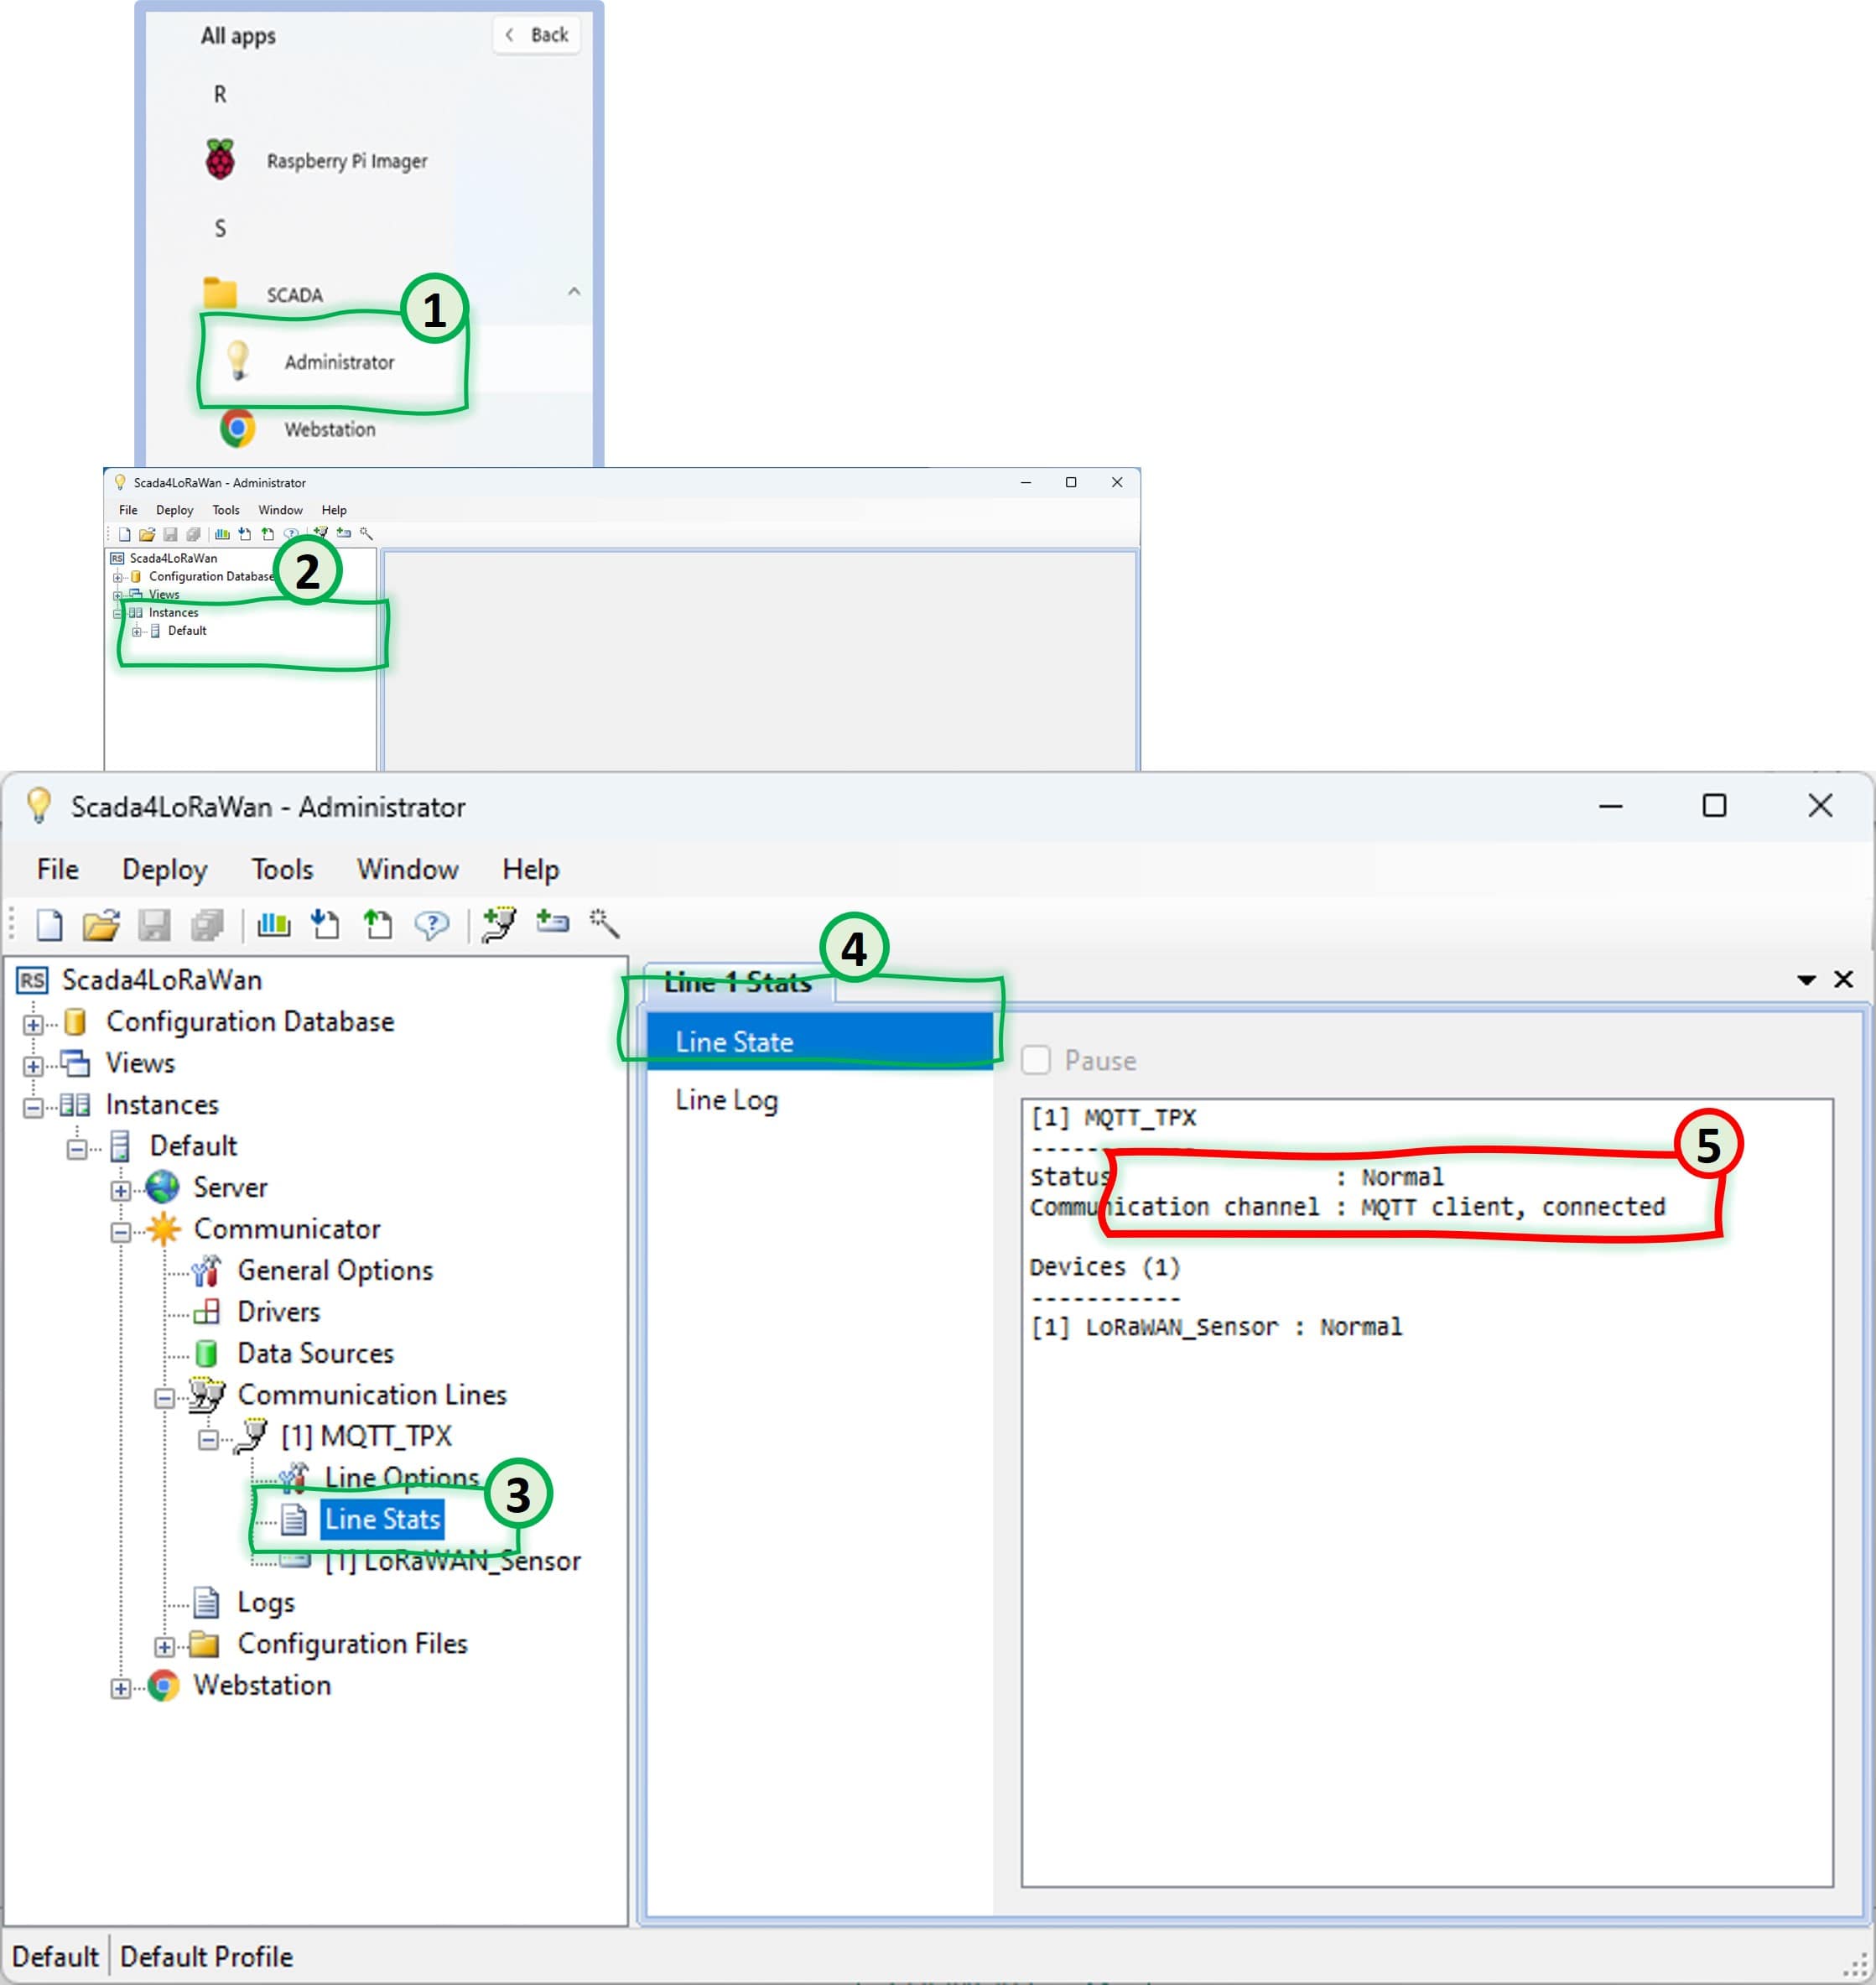
Use the Rapid Scada Admin application to view the data collection at the Rapid SCADA engine.
You can access the Administration application of the Rapid SCADA on the same machine that you installed the Rapid SCADA.
Please note that the administration application is not password protected, so you need to be careful about who can access your Windows account.
You can verify the connection status to the MQTT Server, which is shown as line state. The status should be Normal.
Click on Administration icon under the SCADA group.
Click on Default icon under the Interfaces group.
Click on the Line Stats icon under the MQTT_TPX (your channel), which can be found under the Communication Line definition list.
Click to Line State icon to view communication line status.
You can verify if connection MQTT Server is Normal or not.
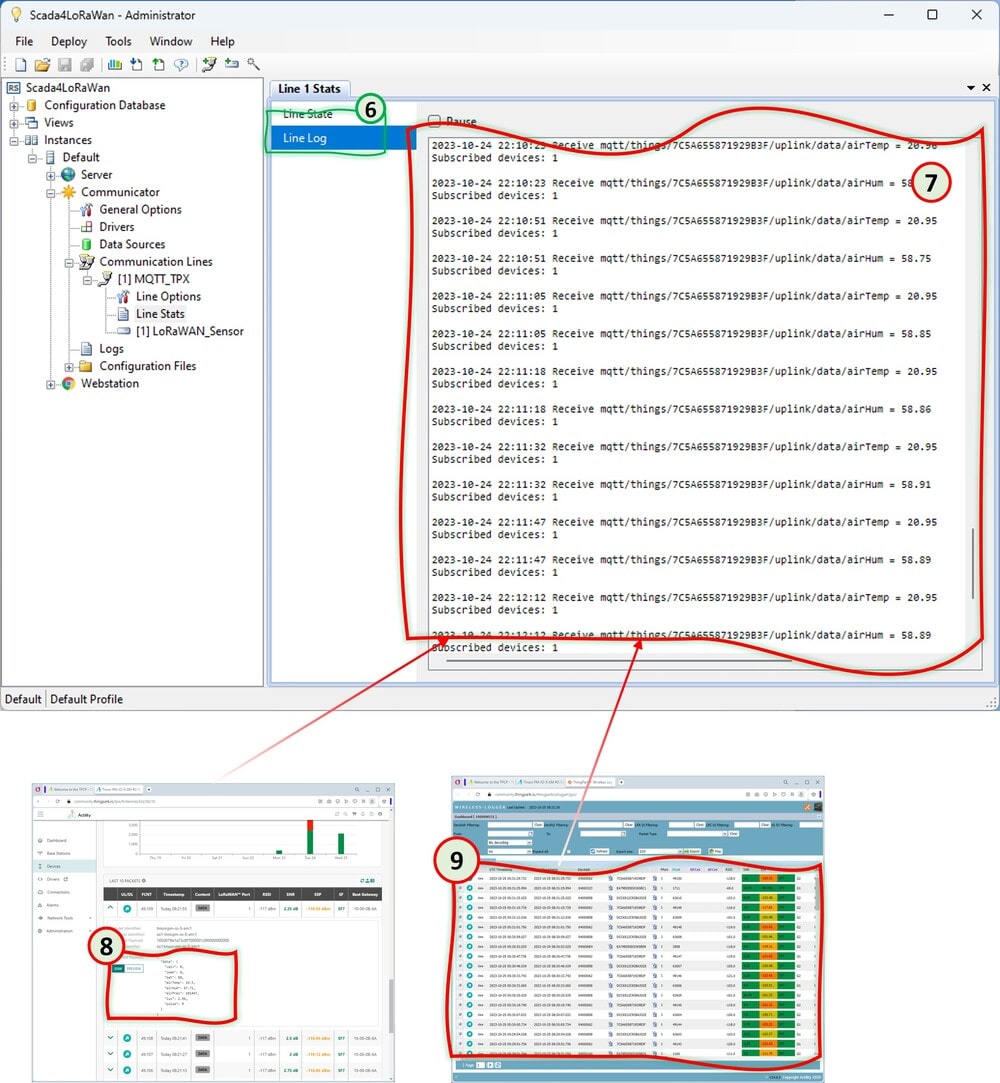
Now, you can view the data fetched from the MQTT Server as a list. You should see the messages that you saw at the previous step, i.e., Monitor the LoRaWAN® packets at the TPC Admin console.
Click on Line Log to open the received message panel.
You can view the received MQTT packets.
So, you should be able to view the same record that you saw in the Last 10 packets section of your device at the TPC Admin console.
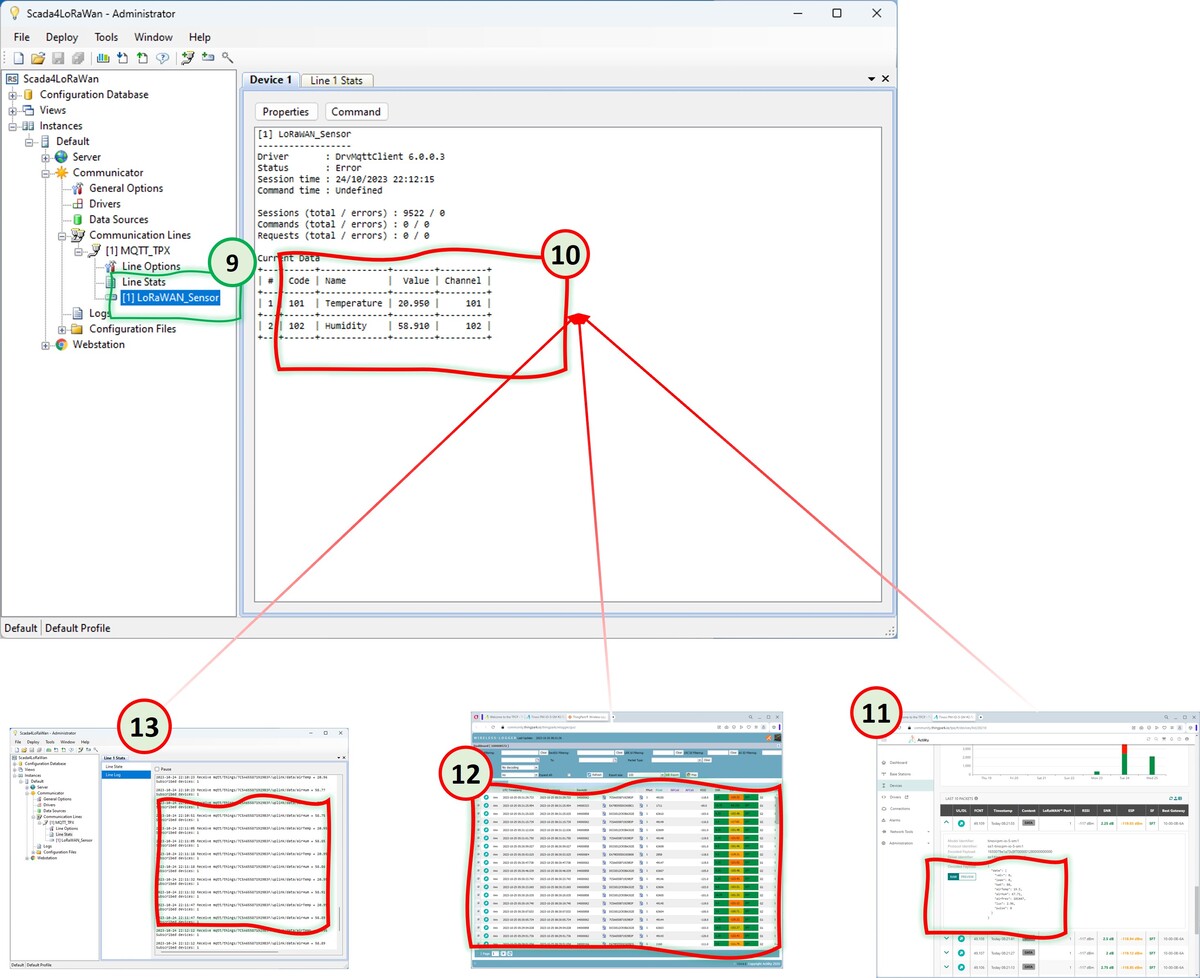
Finally, you can view that received values are mapped to Channels, which can be used for further processing like reports.
Click on LoRaWAN®_Sensor to open device status
You can verify that the values are mapped to Channels.
You can verify that the values are mapped to Channels.
The last footprint of the data on the Administration application can be found at Device Details, which shows the last received data, and you should be able to follow it at the TPC Admin console 11, TPC 12 Wireless Logger 13 and line log.