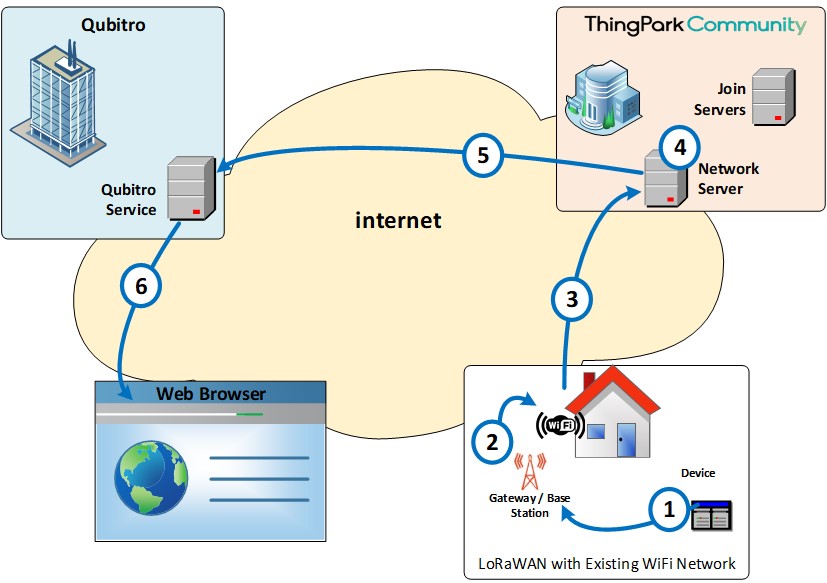
This following diagram gives an overview of the data flow. At a high level, the LoRaWAN® gateway(s) are used for wireless transmission of the data between the network and the end-device. Gateways are connected to the Network Server (ThinkPark Community), which acts as a conduit to the application platform (Qubitro).
Solution Overview
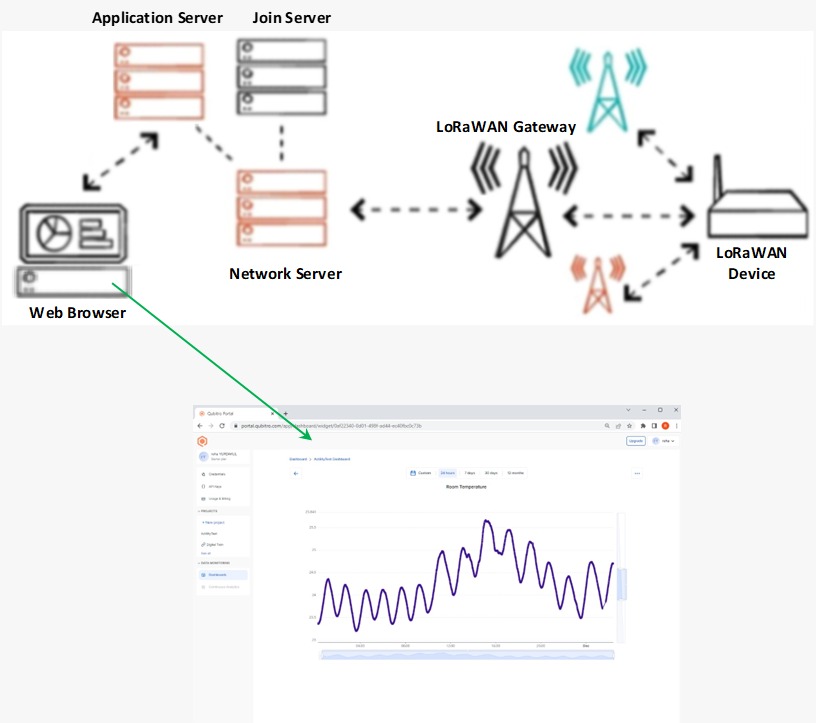
When you complete this activity, you will be able to use the web browser to view the sensor data.
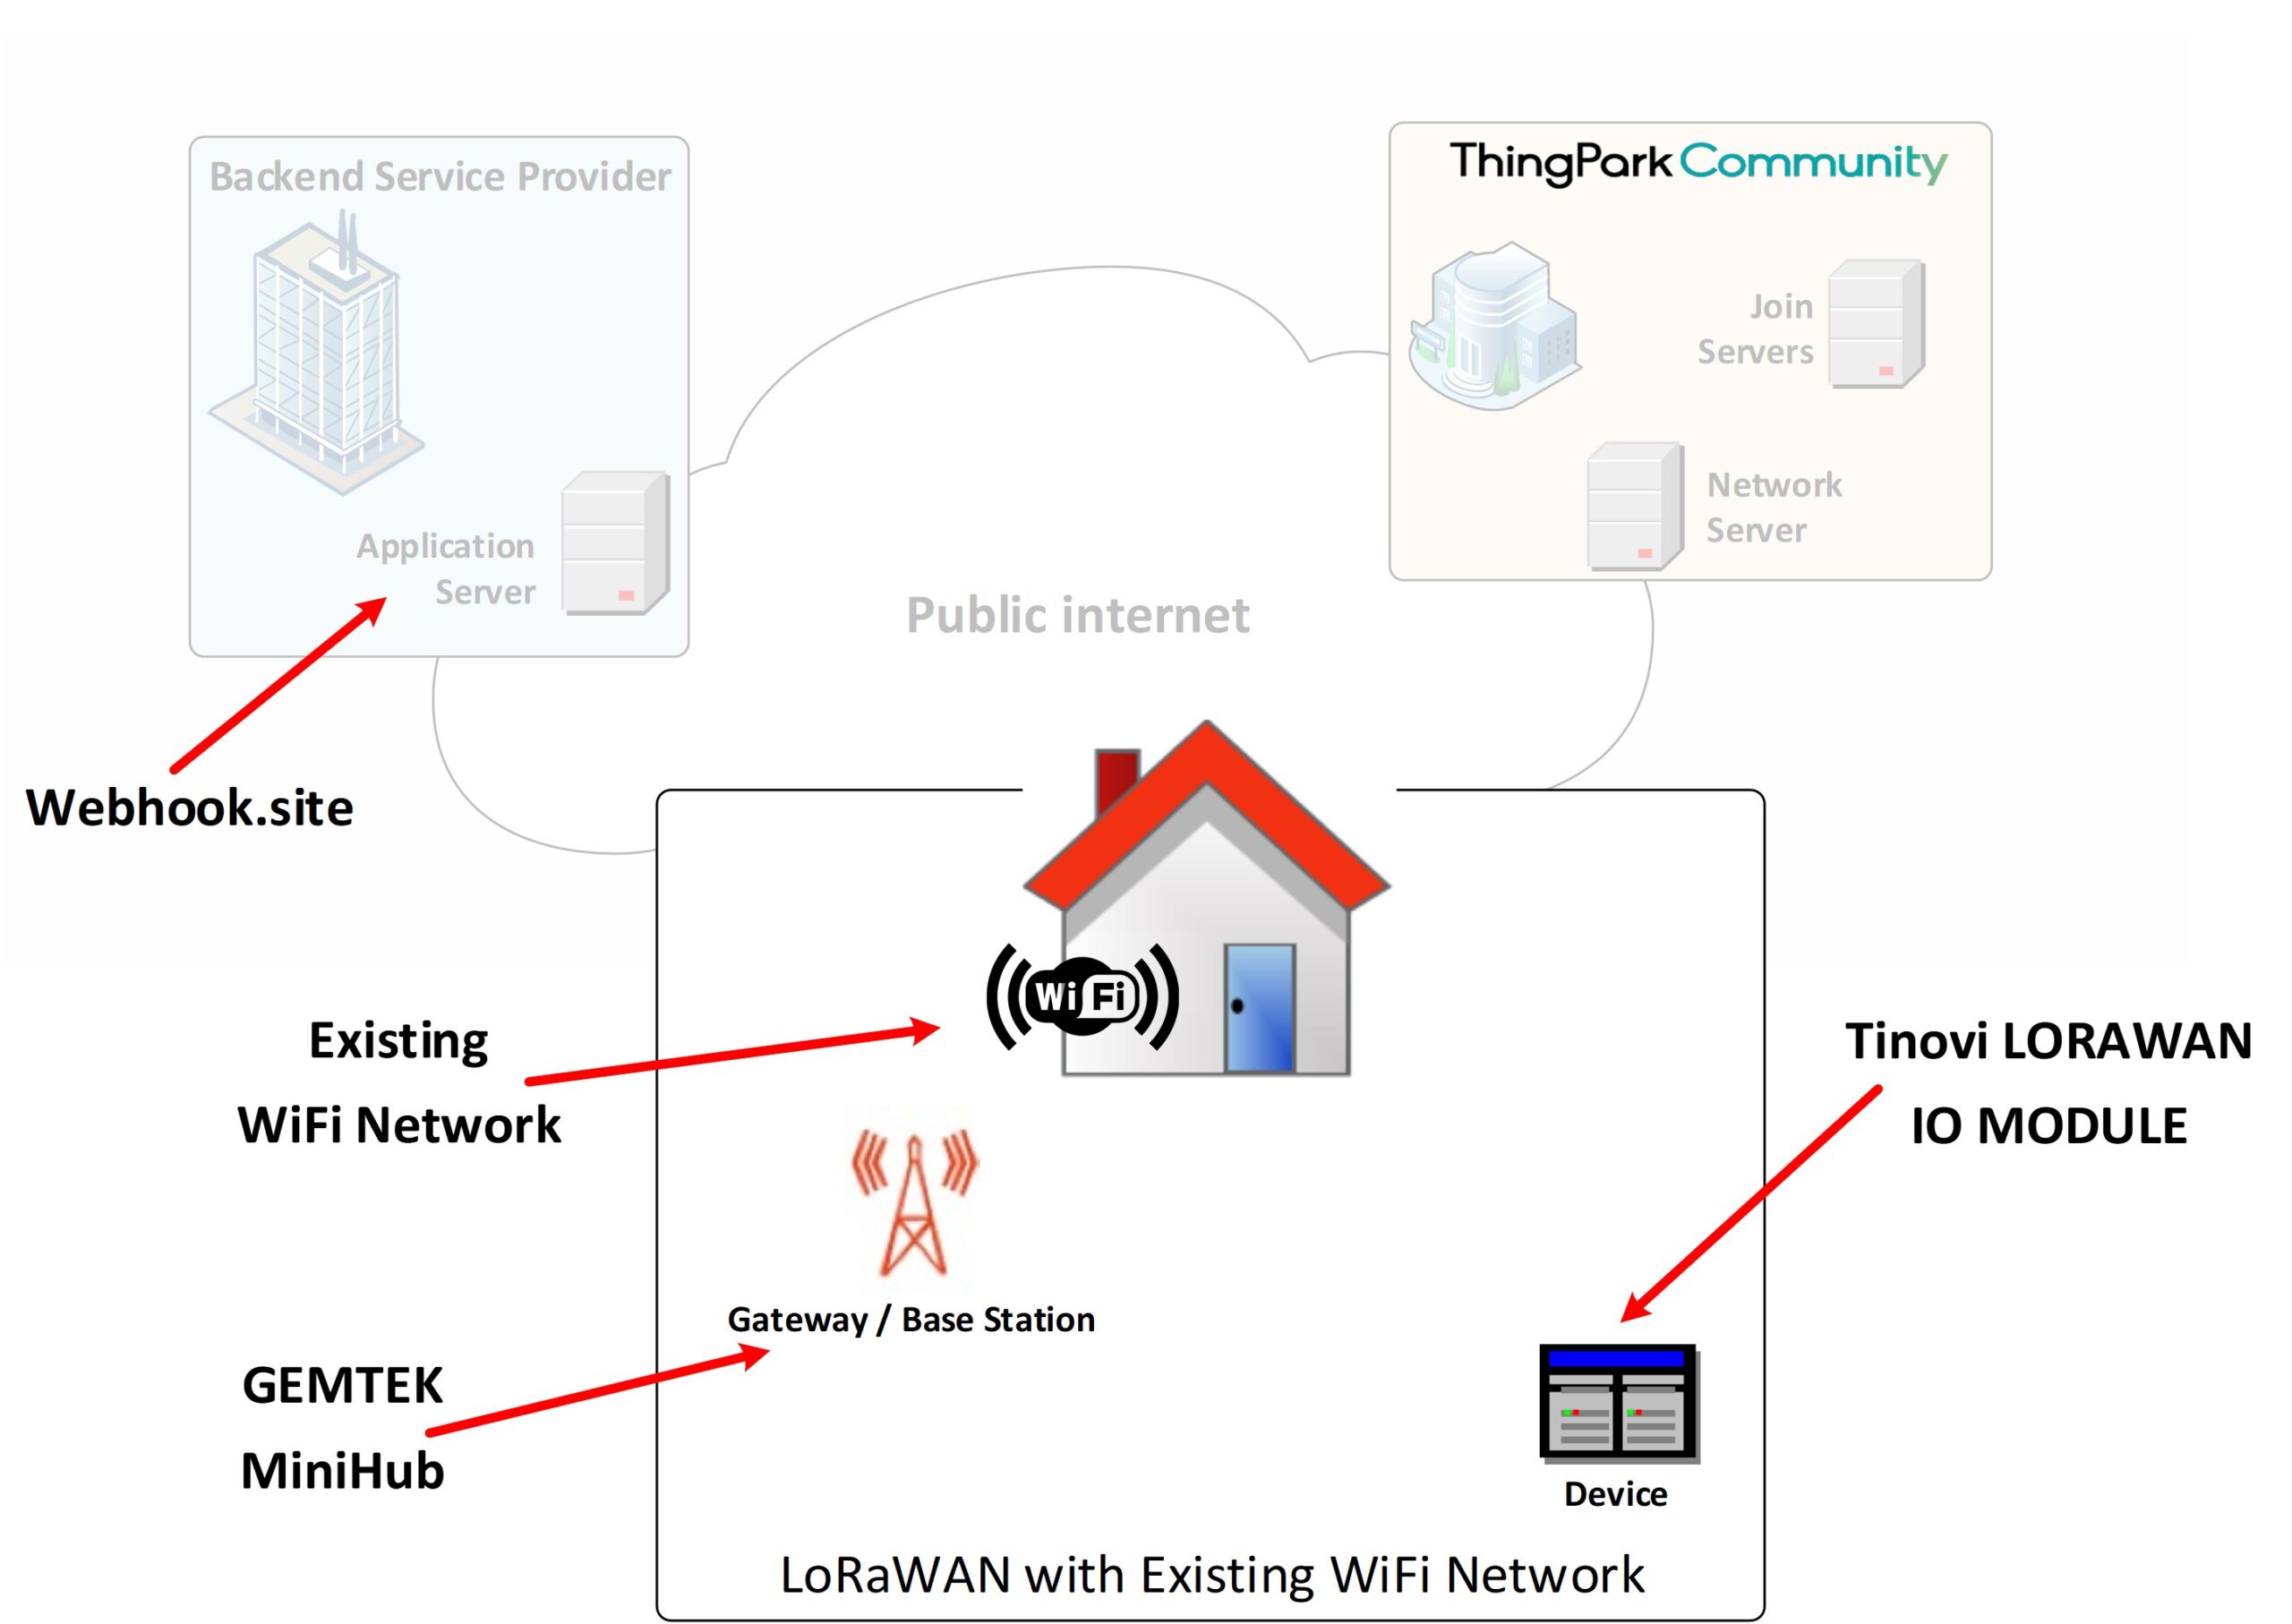
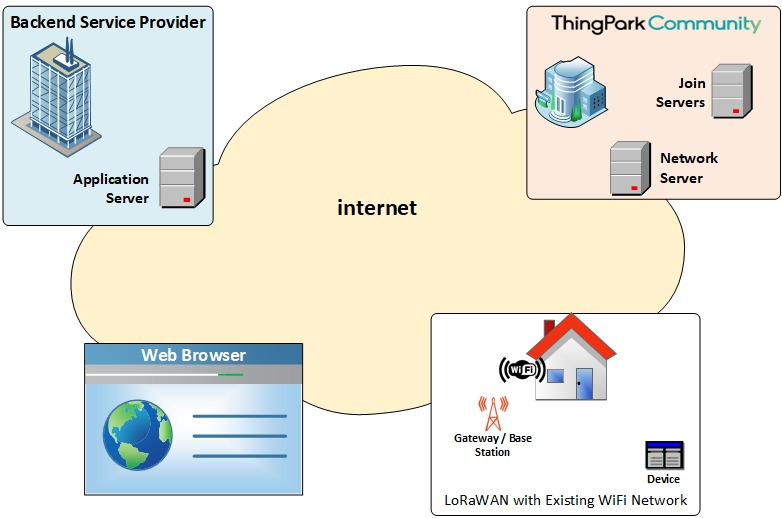
Previously
The environment depicted below was created by following the instructions provided by the Welcome LoRaWAN® and ThingPark cookbook. The webhook website was used to display the data that was gathered. However, It does not allow you to do further processing with the data collected by the sensor.
Now
As you follow this cookbook, you will expand your ability to build a device dashboard, which presents sensor data, and access that dashboard by using a browser.
Solution flow…
The picture depicts the flow of the data that was collected from the sensors. The flow’s first three stages were previously explained at Welcome LoRaWAN® and ThingPark cookbook. Only three additional flow stages between 4 and 6 are introduced in this new activity.