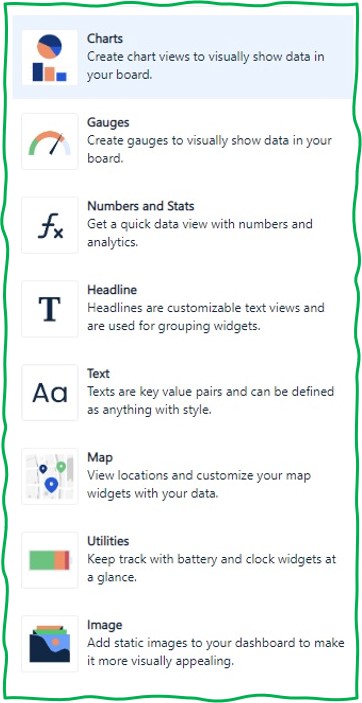
Because the data from the sensors have begun to flow into the application platform (which is Qubitro in this activity), it is now time to visualize the data. To achieve this goal you will work with various types of widgets.
Step 6 - Create a dashboard to display sensor data on Qubitro
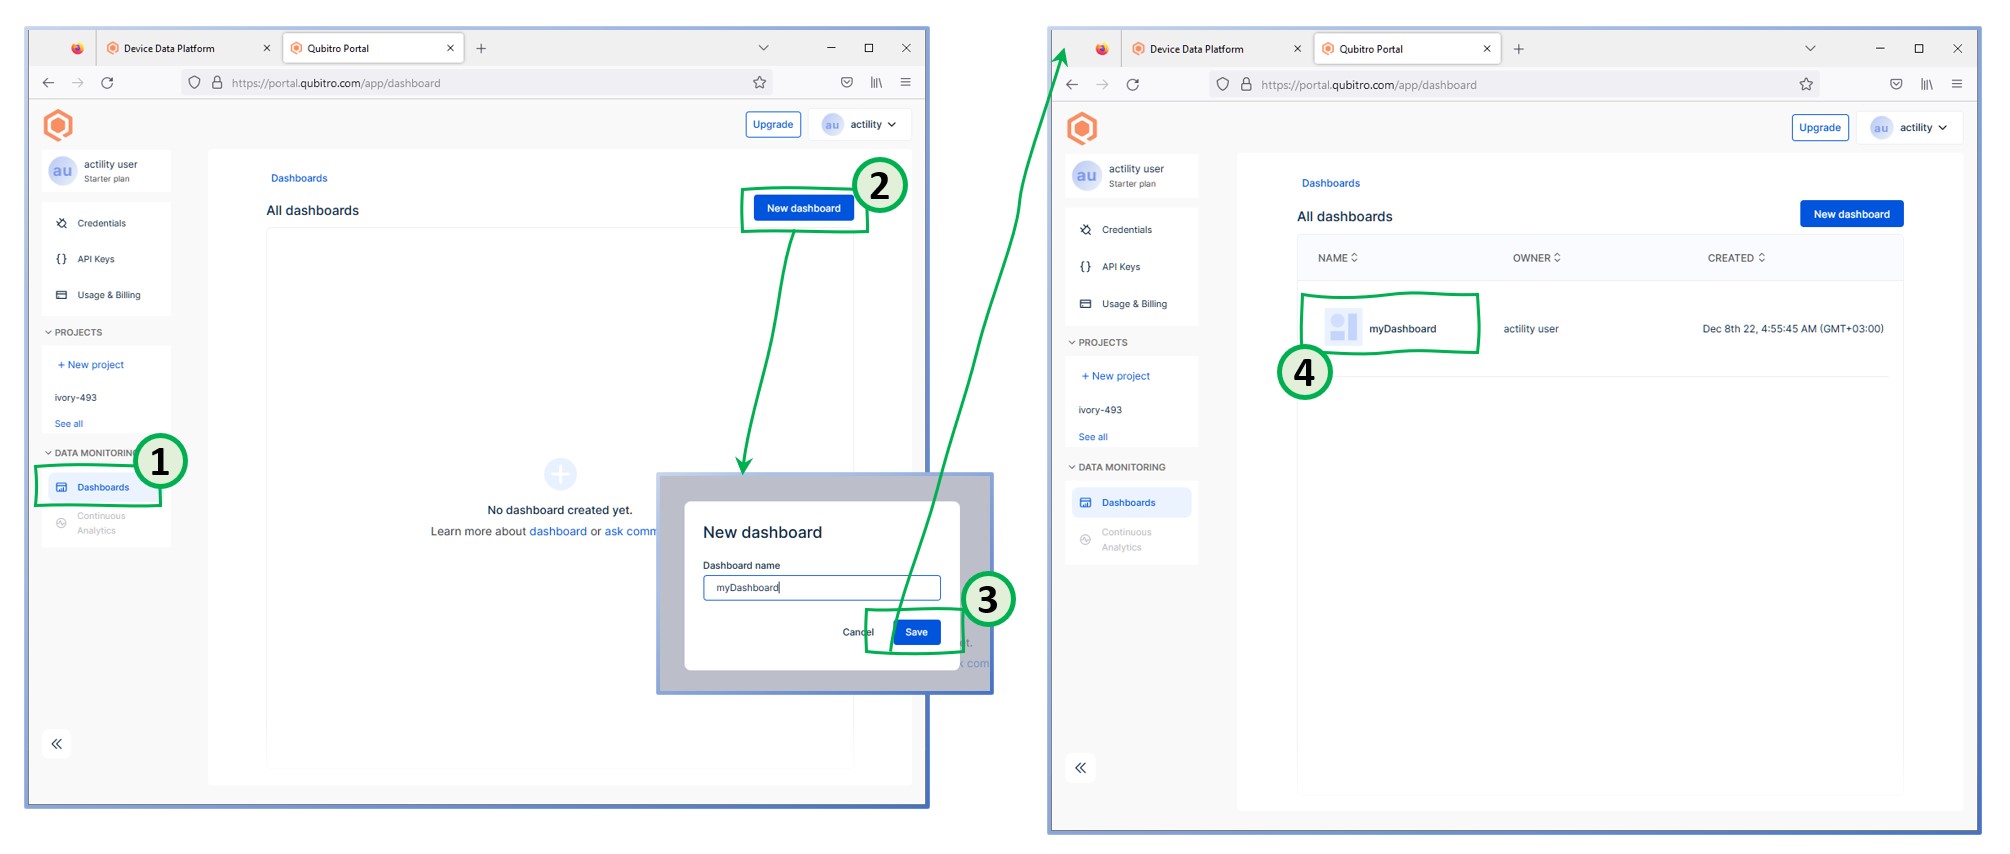
![]() You need to create a dashboard (please notice that only 1 dashboard is allowed in the free plan).
You need to create a dashboard (please notice that only 1 dashboard is allowed in the free plan).
![]()
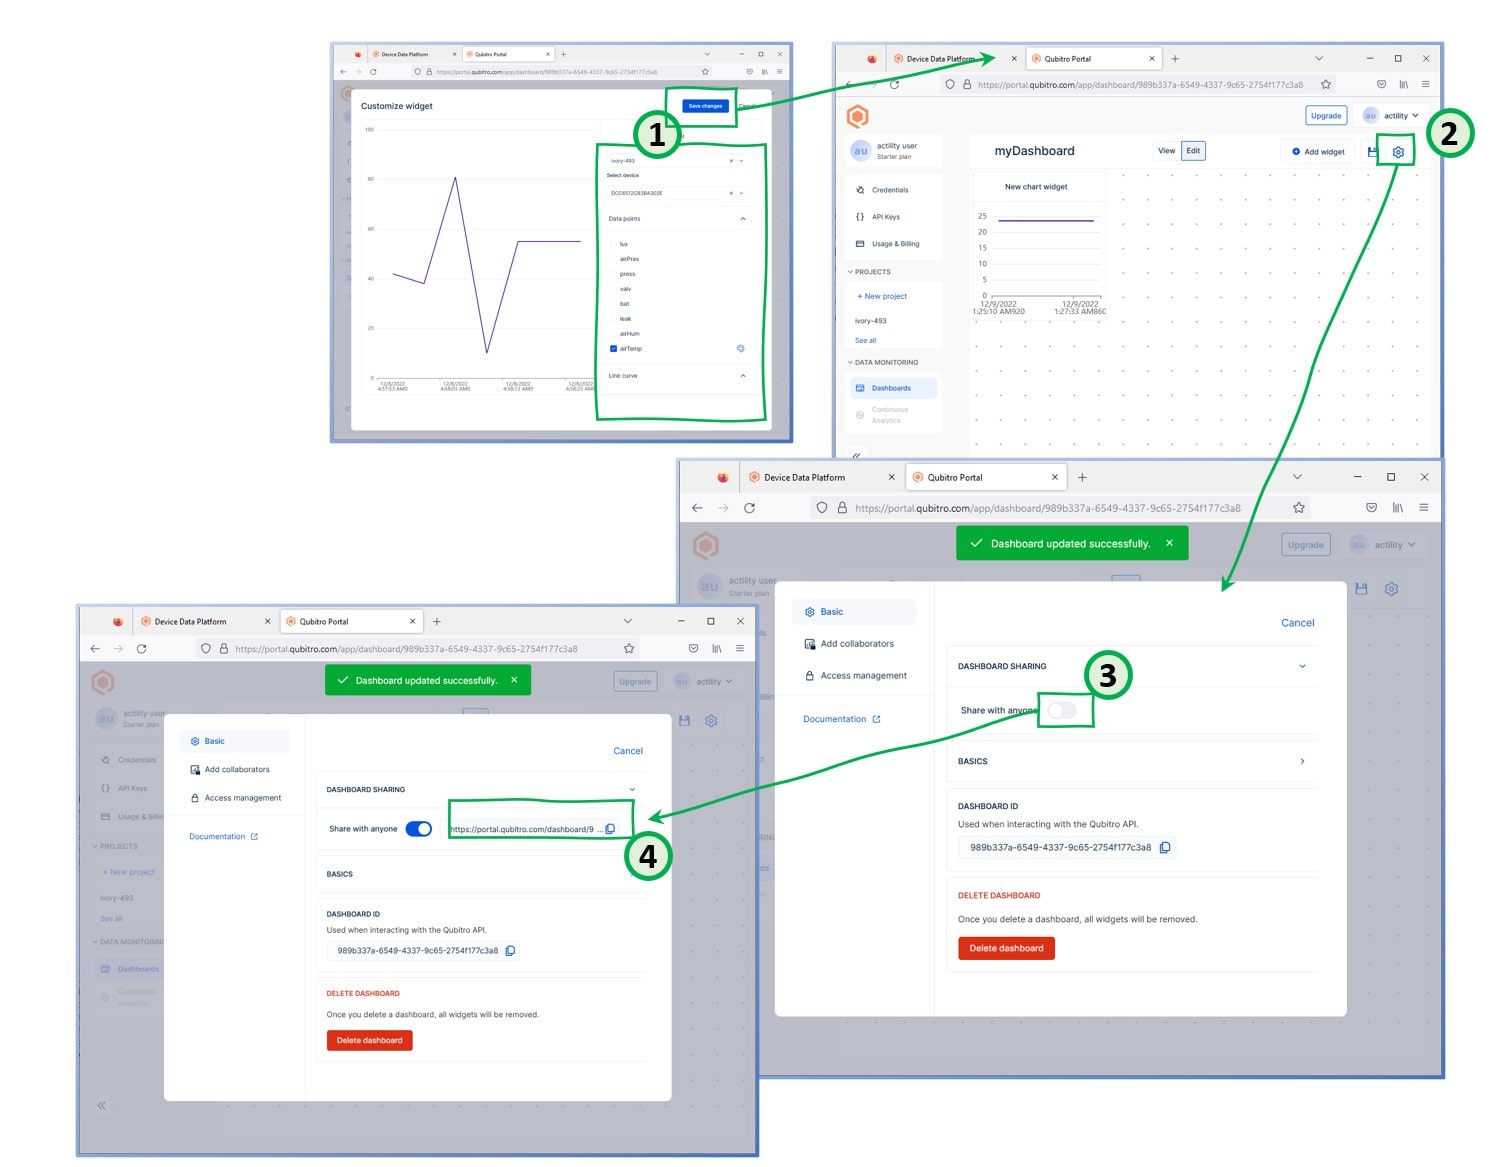
You will need to set this dashboard’s permissions to “Share with anyone” before you can make it available to the general public for use.