Step 6 - Create a dashboard to display sensor data on Qubitro

Because the data from the sensors have begun to flow into the application platform (which is Qubitro in this activity), it is now time to visualize the data. To achieve this goal you will work with various types of widgets.

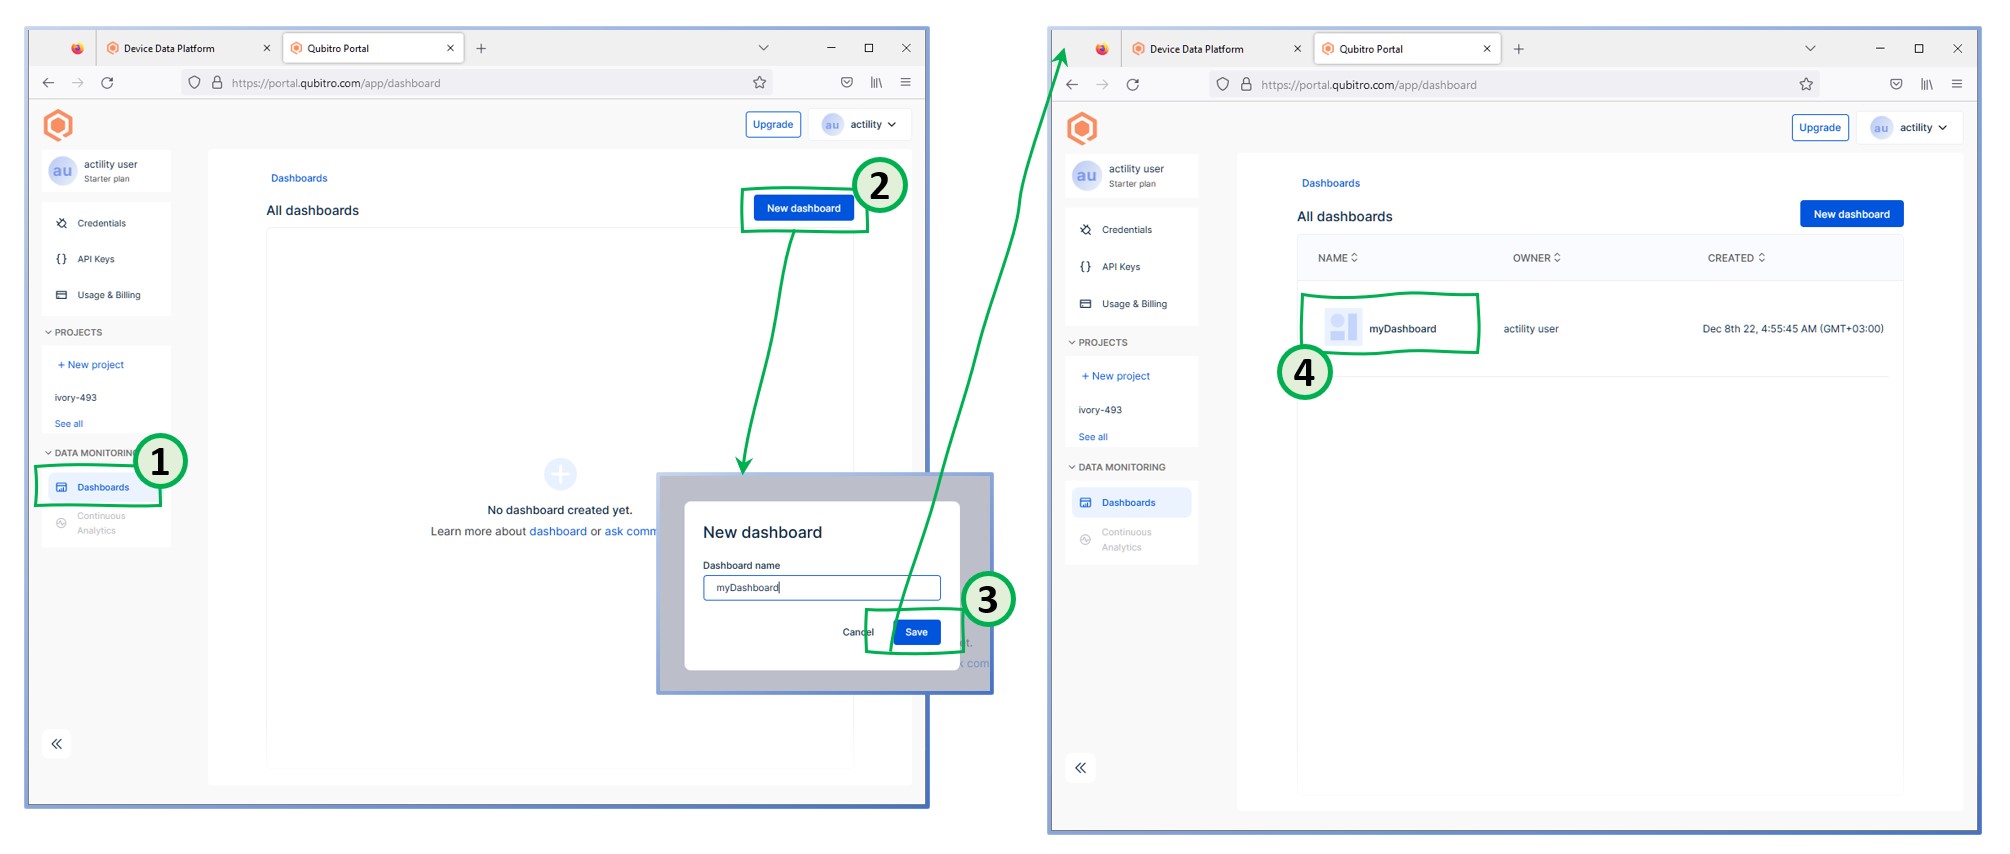
You need to create a dashboard (please notice that only 1 dashboard is allowed in the free plan).

You will need to set this dashboard’s permissions to “Share with anyone” before you can make it available to the general public for use.

1

Select Dashboard panel from the left menu on the application platform (Qubitro).
2

Click New Dashboard to open pop-up dialog in order to enter the dashboard name.
3

Please give a name to your dashboard.
4

Now you can see the new dashboard in the All Dashboards list. Now you have to add widgets which will show the data that you wish to present on the dashboard.
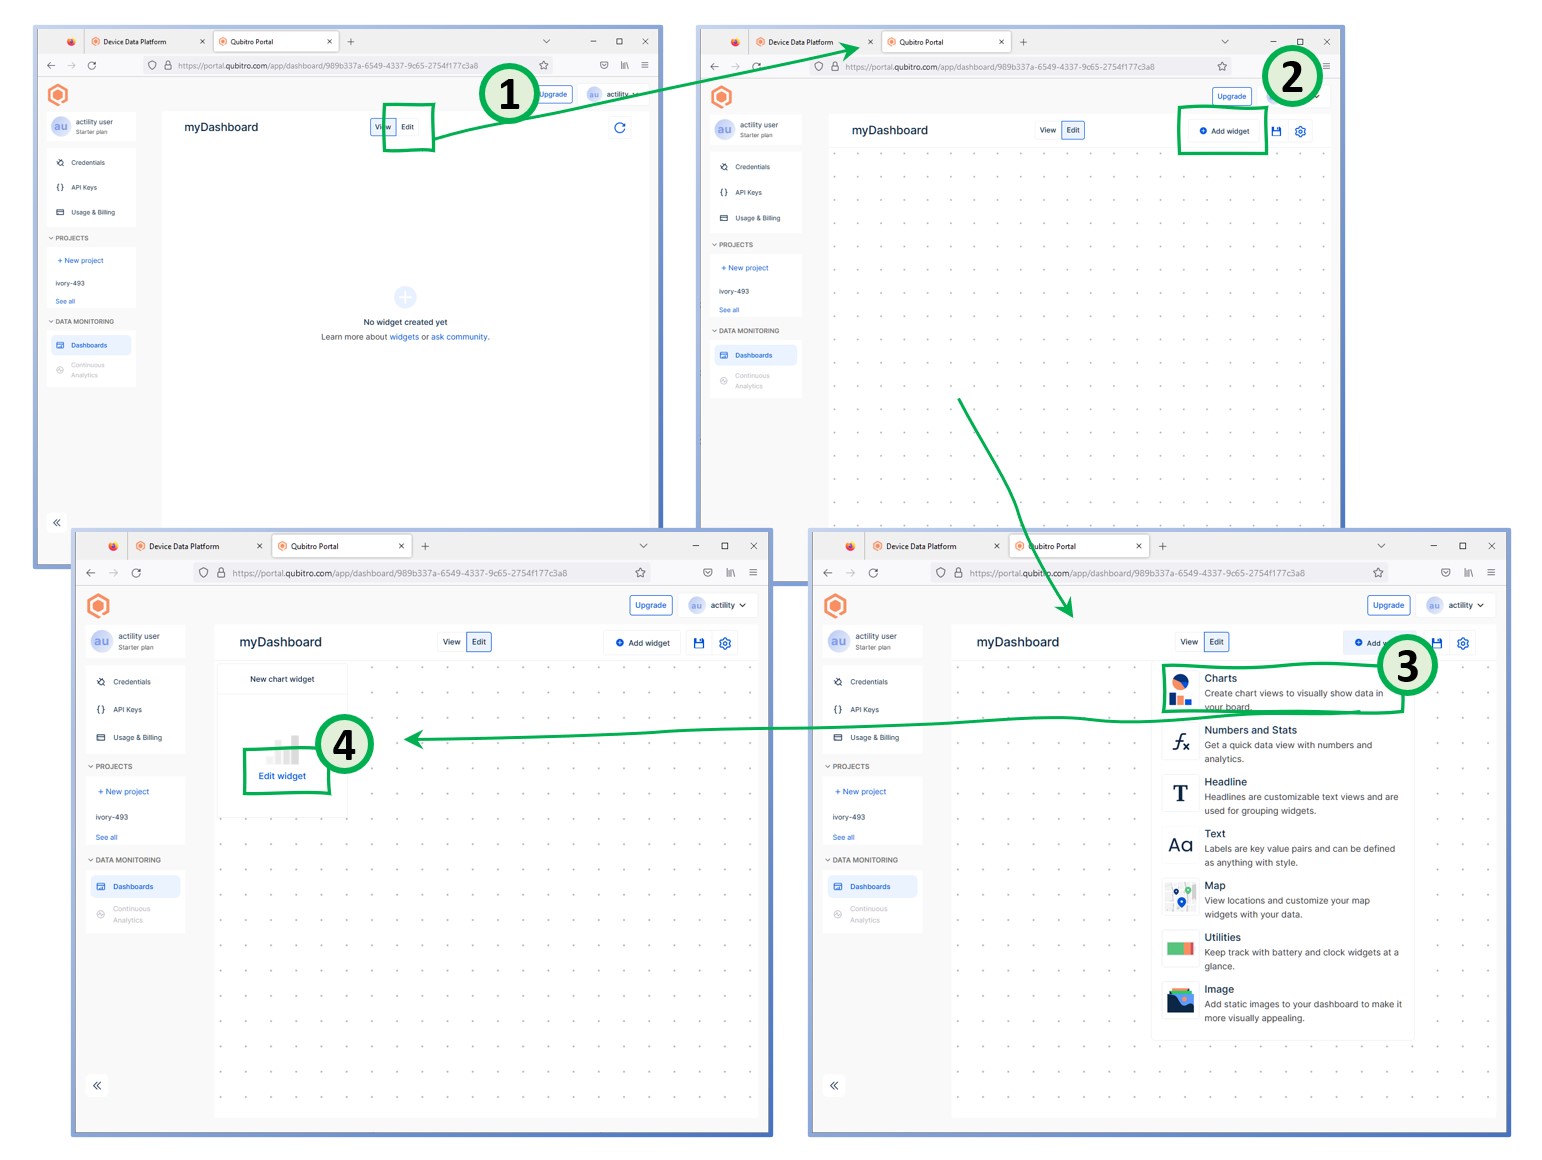
1

First you have to switch into Edit mode.
2

Click to Add Widget to add a widget to your dashboard.
3

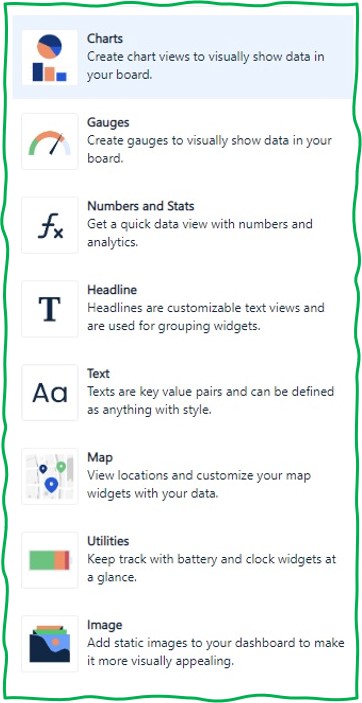
Select Charts from the list of widget types.
4

Click Edit widget in order to customize the widget that you just created.
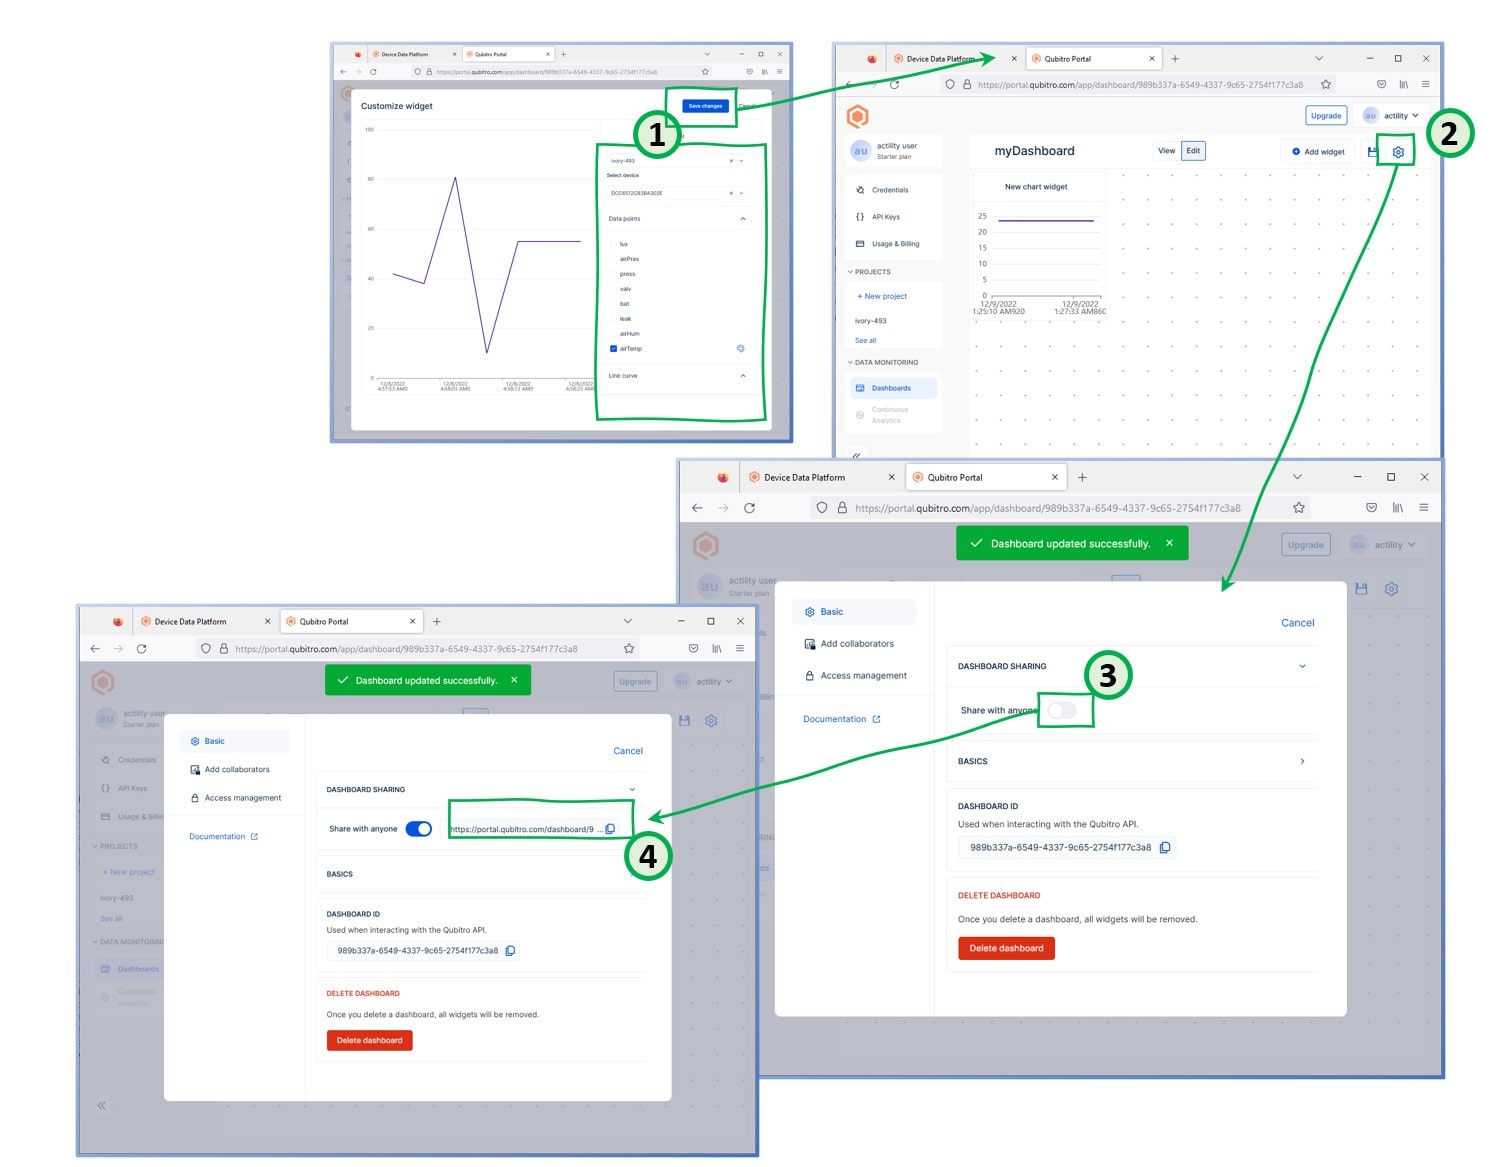
1

Please select/enter following information:

Project Name: Select your project that you created at Step 1
Select Device: The device that had created automatically at Step 5
Data Points: Select airTemp from the list
When completed, click on the "Save Changes" button to save the values and return to dashboard view in edit mode.
2

In order to access additional settings of the dashboard, click on the "Settings" icon.
3

By default, the dashboard is not visible to public. In order to ensure that dashboard is accessible without requiring any user credentials, please move the slider from "Off" to "On", so that anyone who has the URL can view the dashboard.
4

Please note that the active device and uplinks count was 0 when the connection is created at Step 1. Now you can see that the Active device count increased to 1, and uplink packets are not 0 anymore in the Metrics section.
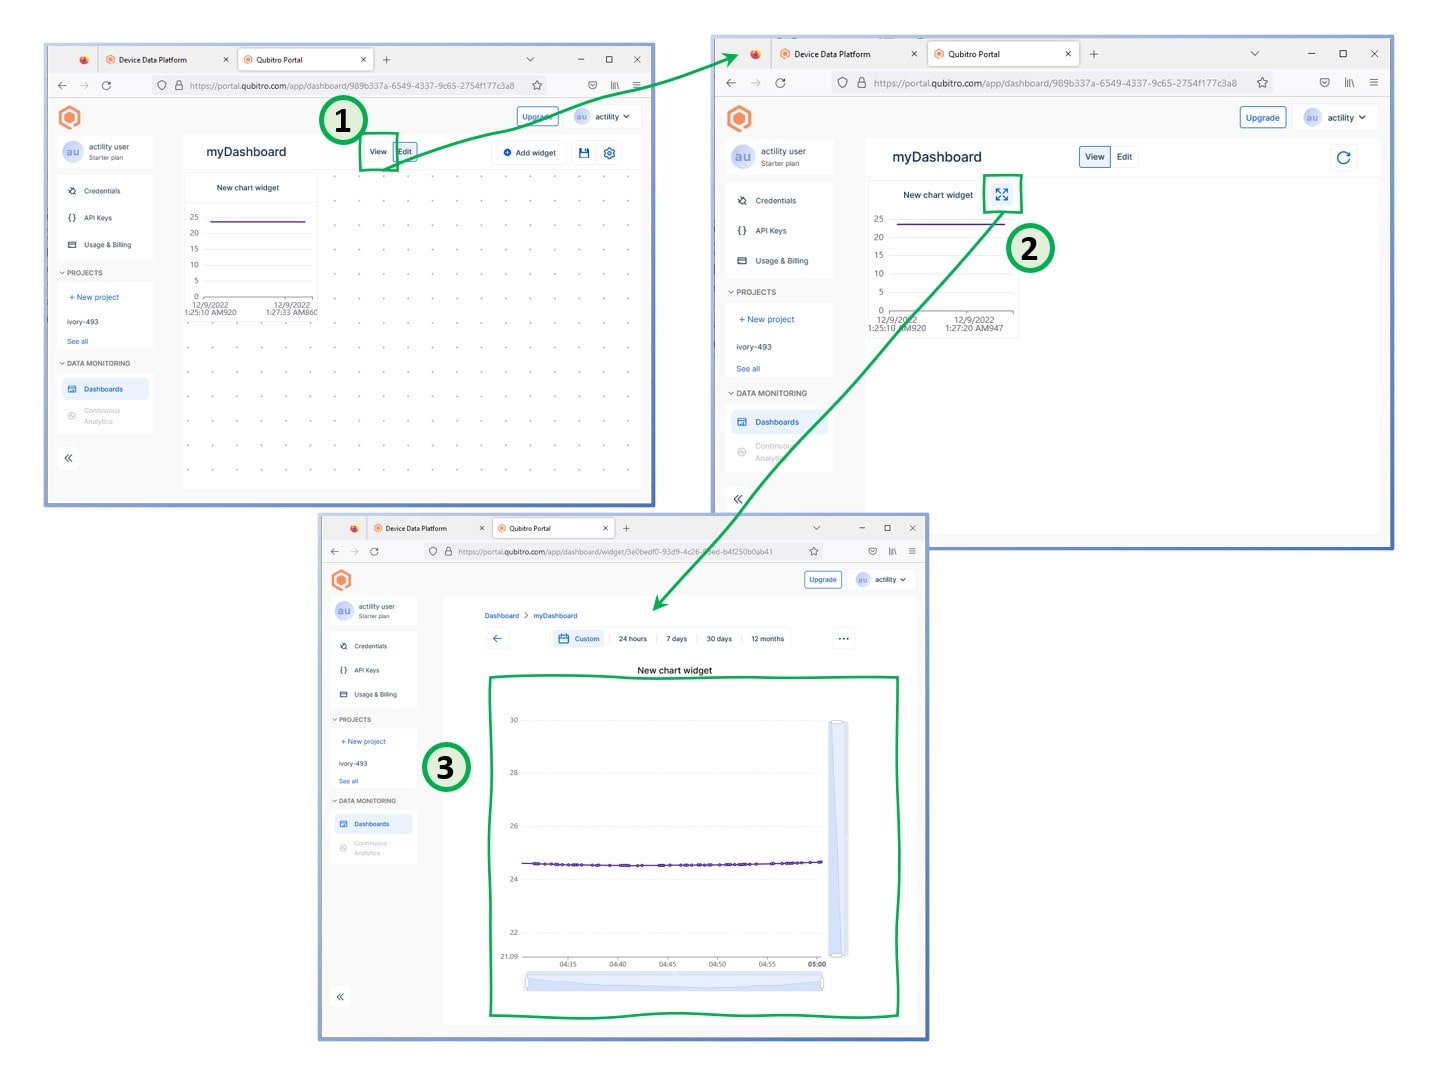
1

In order to view the dashboard, you need to switch from Edit to View mode.
2

For detailed view of any widget, you can click on the "Maximize" icon. This will open a new window with only the selected widget shown.
3

In this view, you can see more details of the selected widget (i.e., selected data). In this view you can change the X and Y axis values. In addition, you can also change the data view interval.