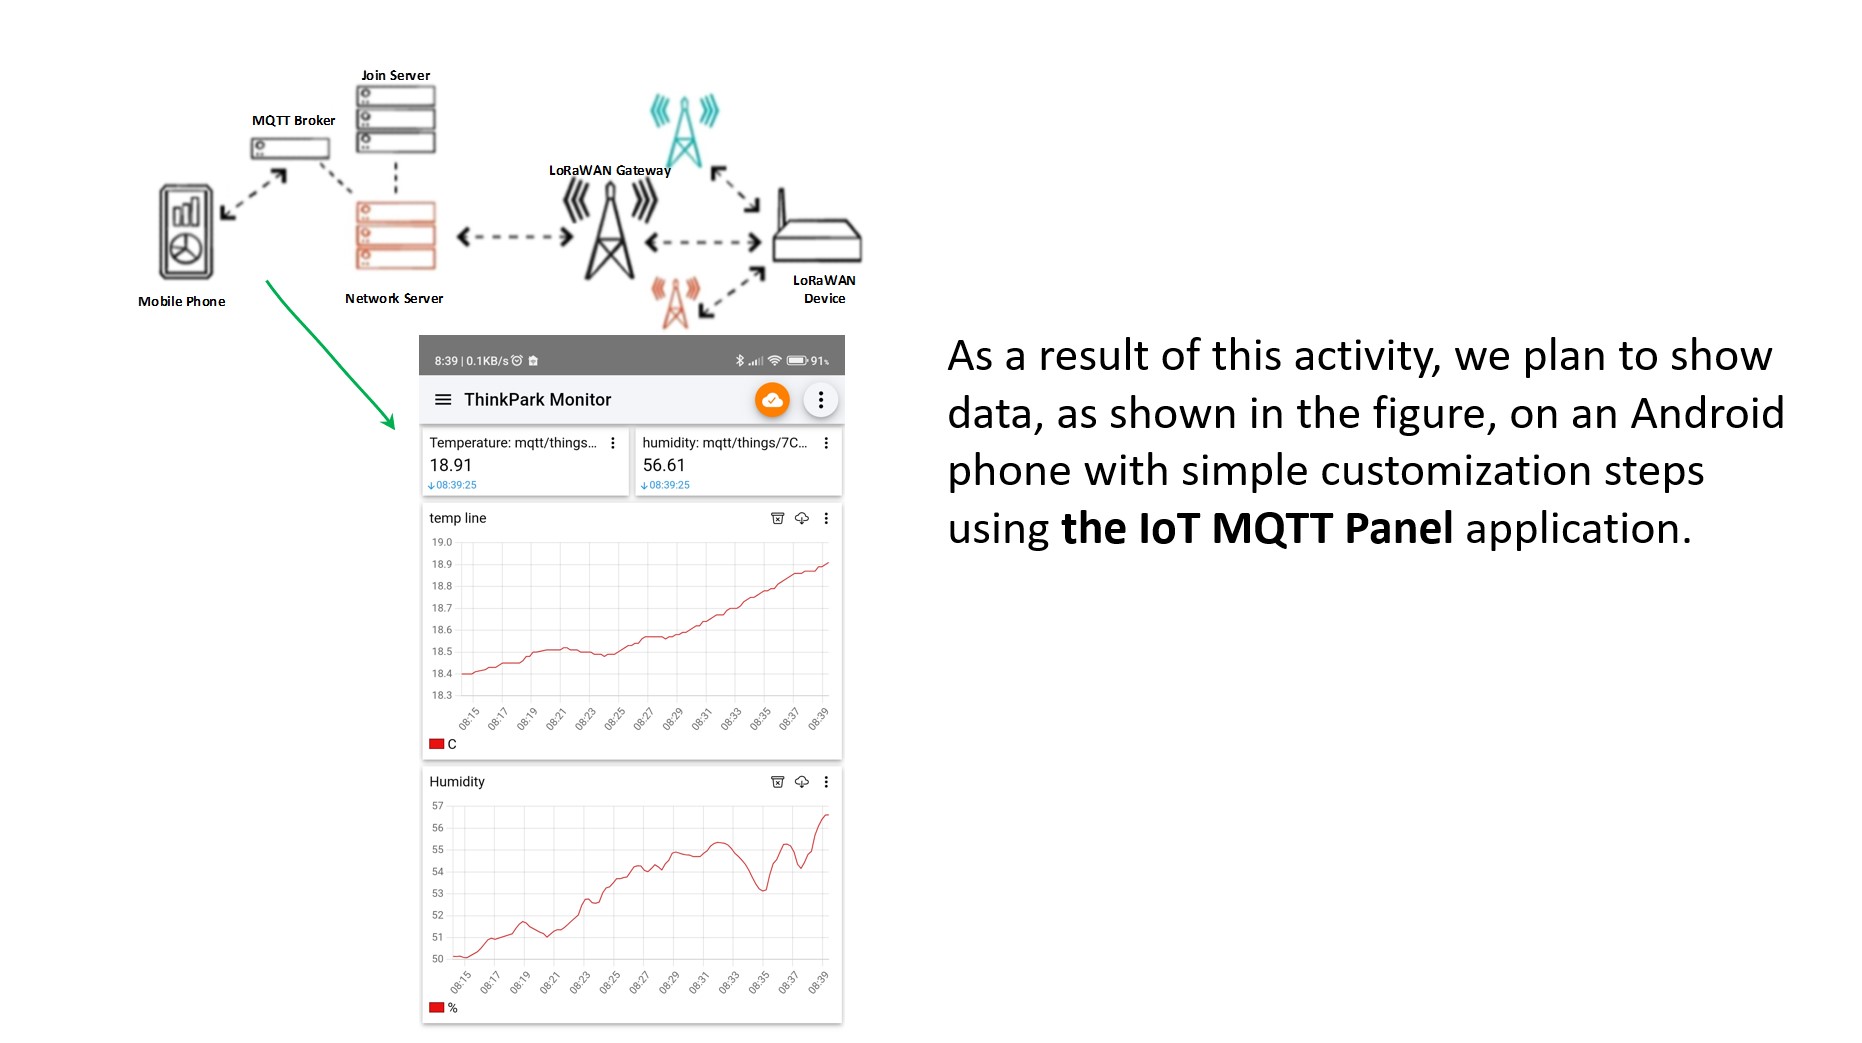
You will prepare a simple solution to visualize the collected sensor data explained in Hello LoRaWAN® and ThingPark cookbook. For this solution, no technical or programming skills are needed. A general outline of the solution is shown below.
Previously…
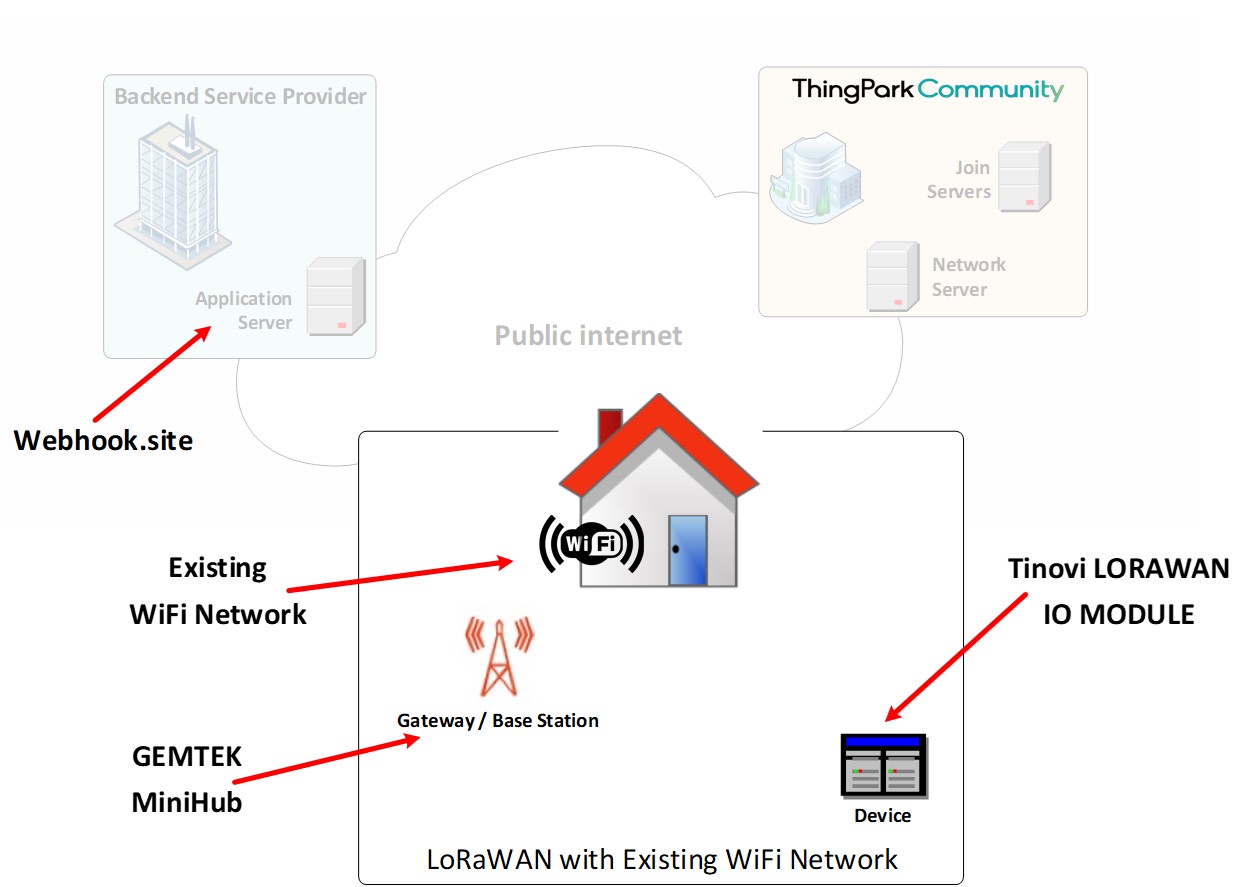
The environment shown below was prepared in the Hello LoRaWAN® and ThingPark cookbook, and the collected data was displayed in its native binary form on the webhook website. However, this environment cannot be used for the end user to actually view the collected measurements, which need to be decoded and graphed.
Solution Flow…
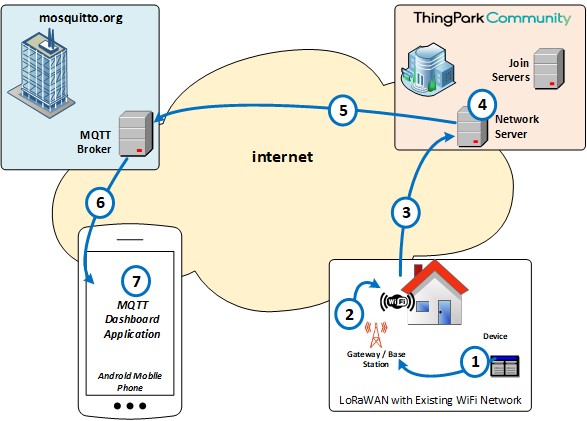
The flow of the collected sensor data is shown in the figure. Flow steps 1~3 are described at Hello LoRaWAN® and ThingPark. In this activity flow steps (4 ~7) are added.


