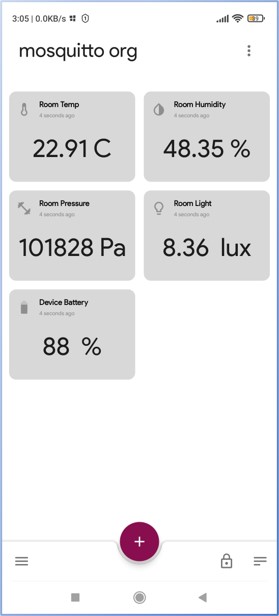
One of the basic needs in any sensor project is to be able to visualize the collected sensor data. In this activity we will display the data collected in the Hello LoRaWAN® and ThingPark cookbook on an Android phone, using only free tools. We will follow simple steps to visualize the collected data. The main differences from the previous cookbook are:
– The use of MQTT protocol instead of HTTP as communication protocol to the backend service.
– The use of mosquitto.org instead of webhook.site as backend service.
We will also discover new features:
– ThingParkX to easily convert binary sensor payload to JSON-formatted information.
– Display the collected data on Android devices using the MQTT Dashboard –IoT and Node-app.
There is no need for new equipment in this activity. Only configuration changes and customization of a mobile phone app will be performed. Finally, although the steps described here are based on the previous cookbooks, they can easily be adapted to any other sensor for visualization: ThingPark X supports CoDecs for most sensors out-of-the-box.

