- Get Started▼
- Journeys▼
- Hands on Labs▼
- 1 – Hello LoRaWAN® and Thingpark®
- 2 – Easy LoRa Basics Station setup
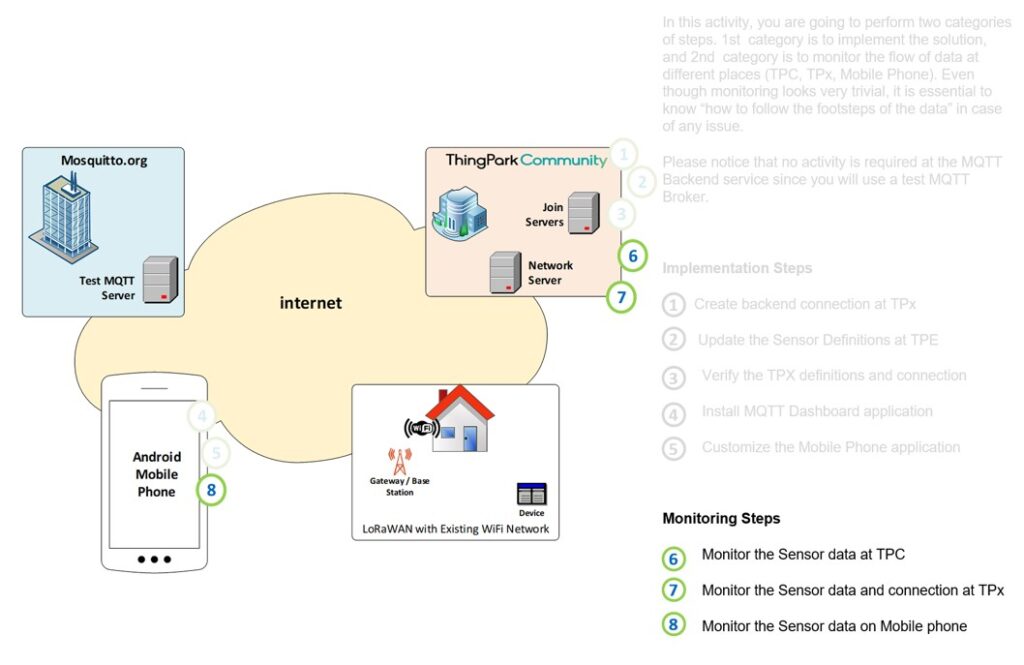
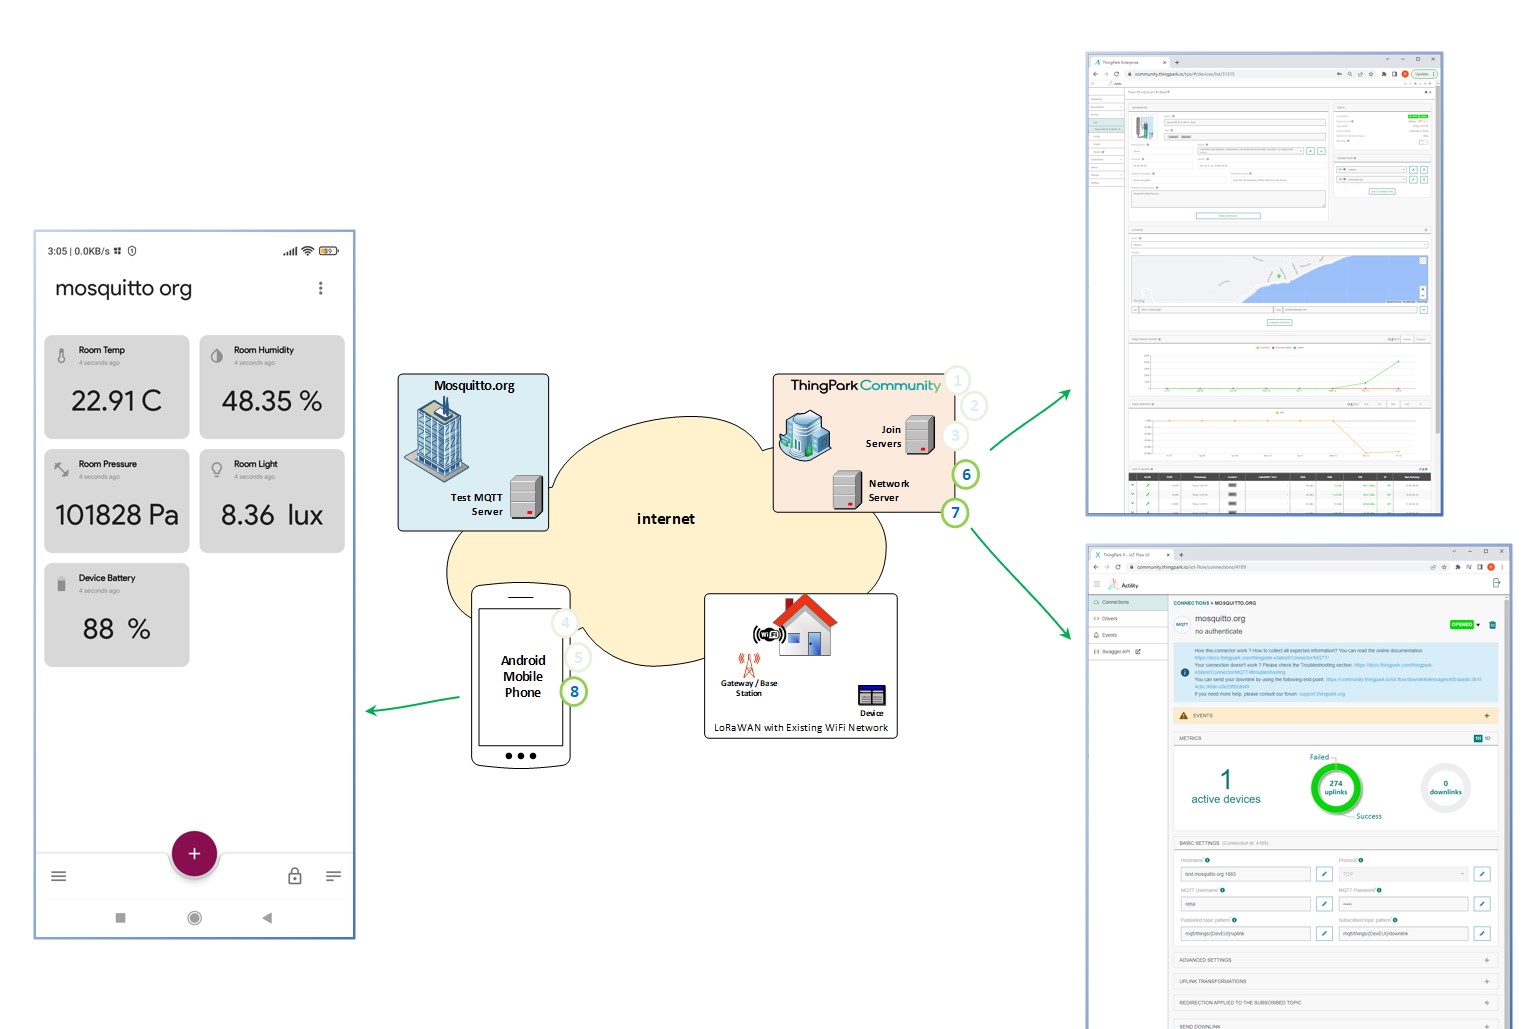
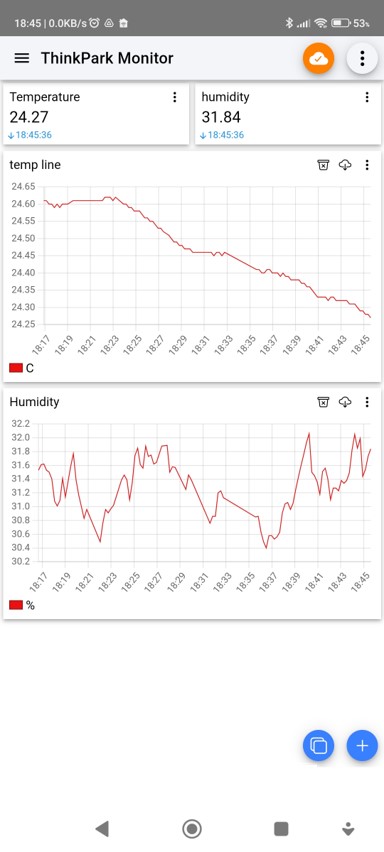
- 3 – Easily Visualize LoRaWAN® Sensor Data On Your Mobile Phone
- 4 – Use Web Browser to View Sensor Data With TPE, TPX and Qubitro
- 5 – Getting Started with Abeeway Geolocation Module Discovery Kit
- 6 – Introduction to TPC for Arduino Makers
- 7 – Tracking Personnel with Abeeway Smart Badge
- Get Hardware
- ThingPark® Platforms▼
- Support Options▼
- Register
- Log In