If you have completed all steps correctly, you should be seeing the data sent by the end-device on the webhook site
STEP – 7
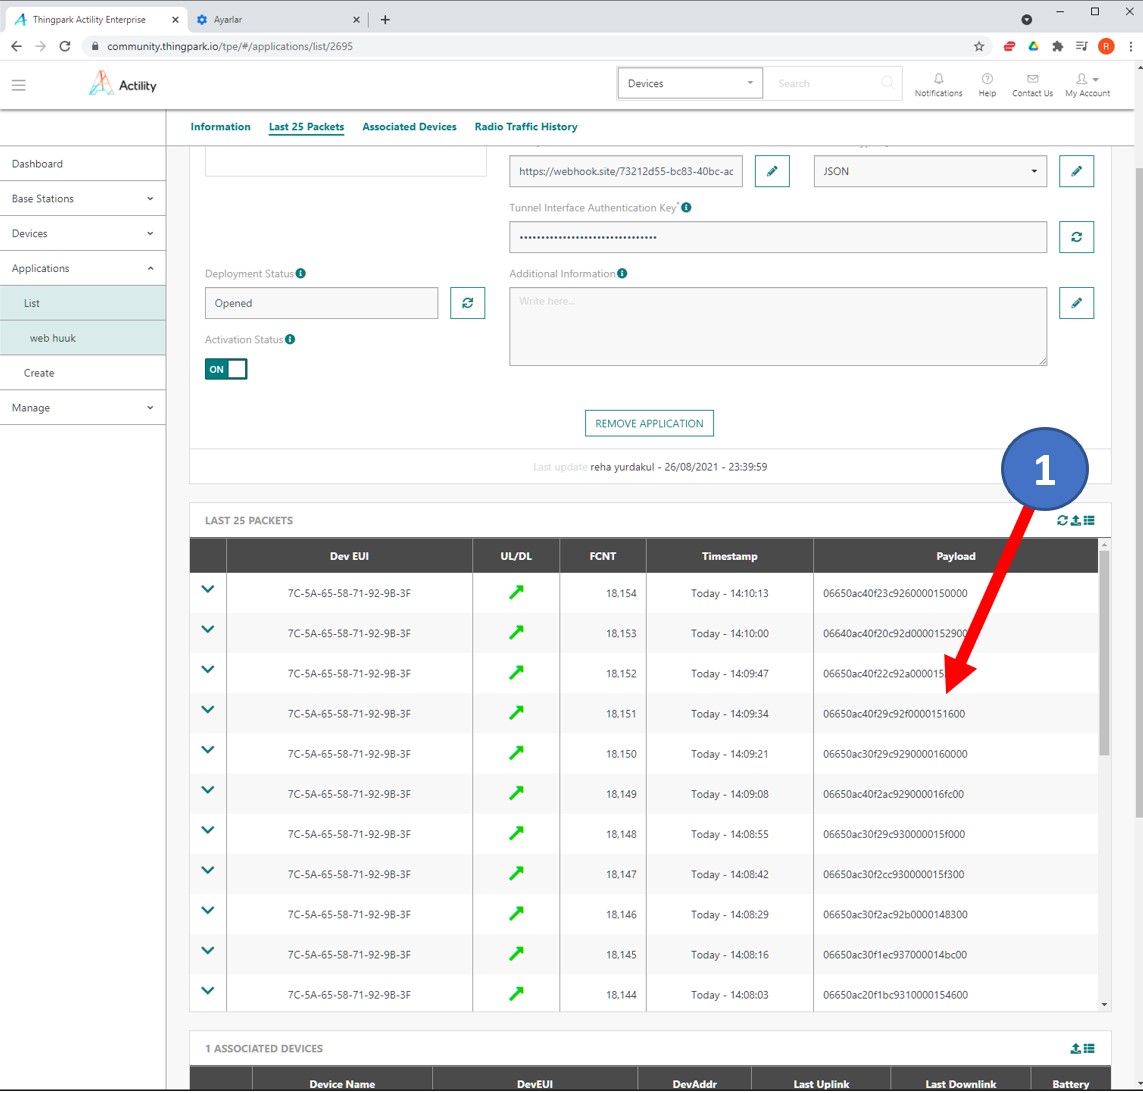
Monitor the Sensor Data on TPC Platform
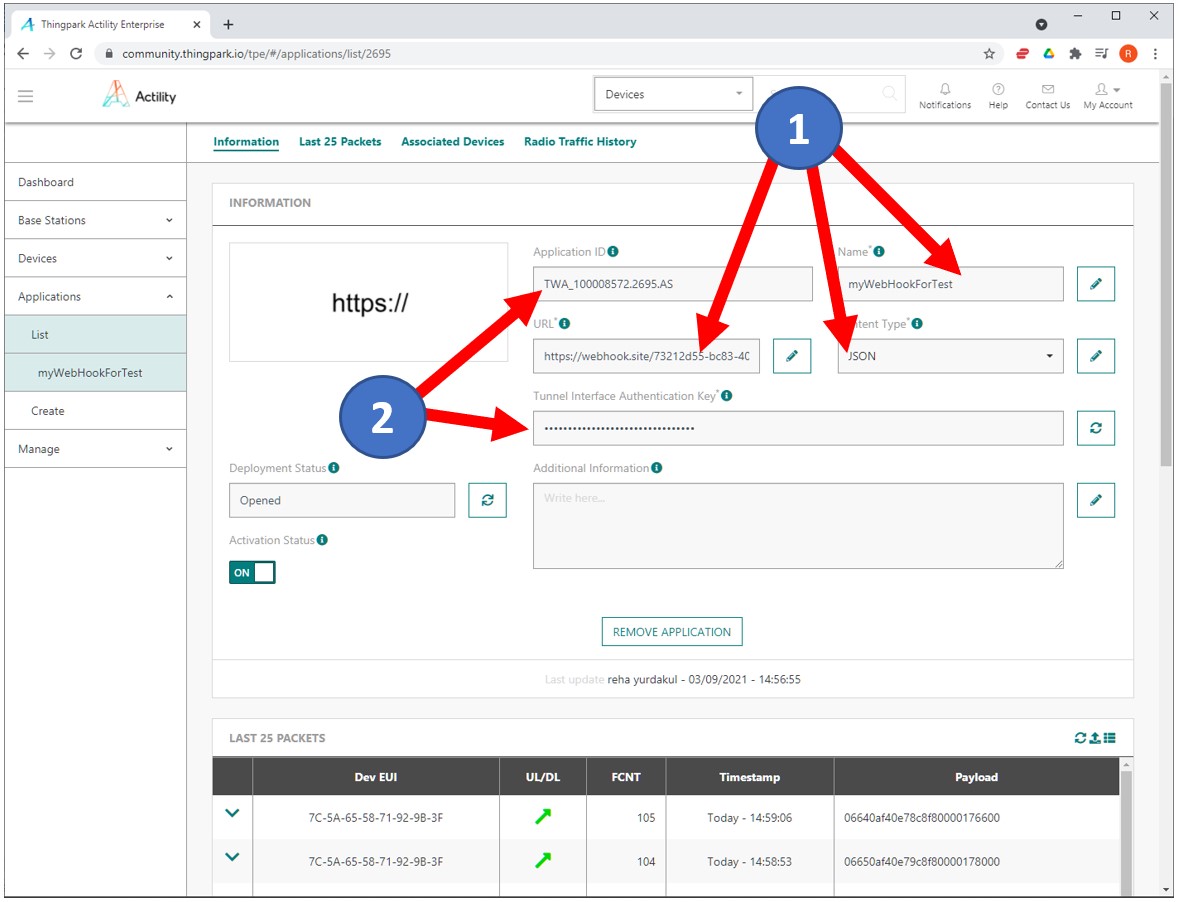
At this step, you will have a look at the application that you created and observe the data traffic .. You can access to Application information via Applications > List on the menu as shown below.
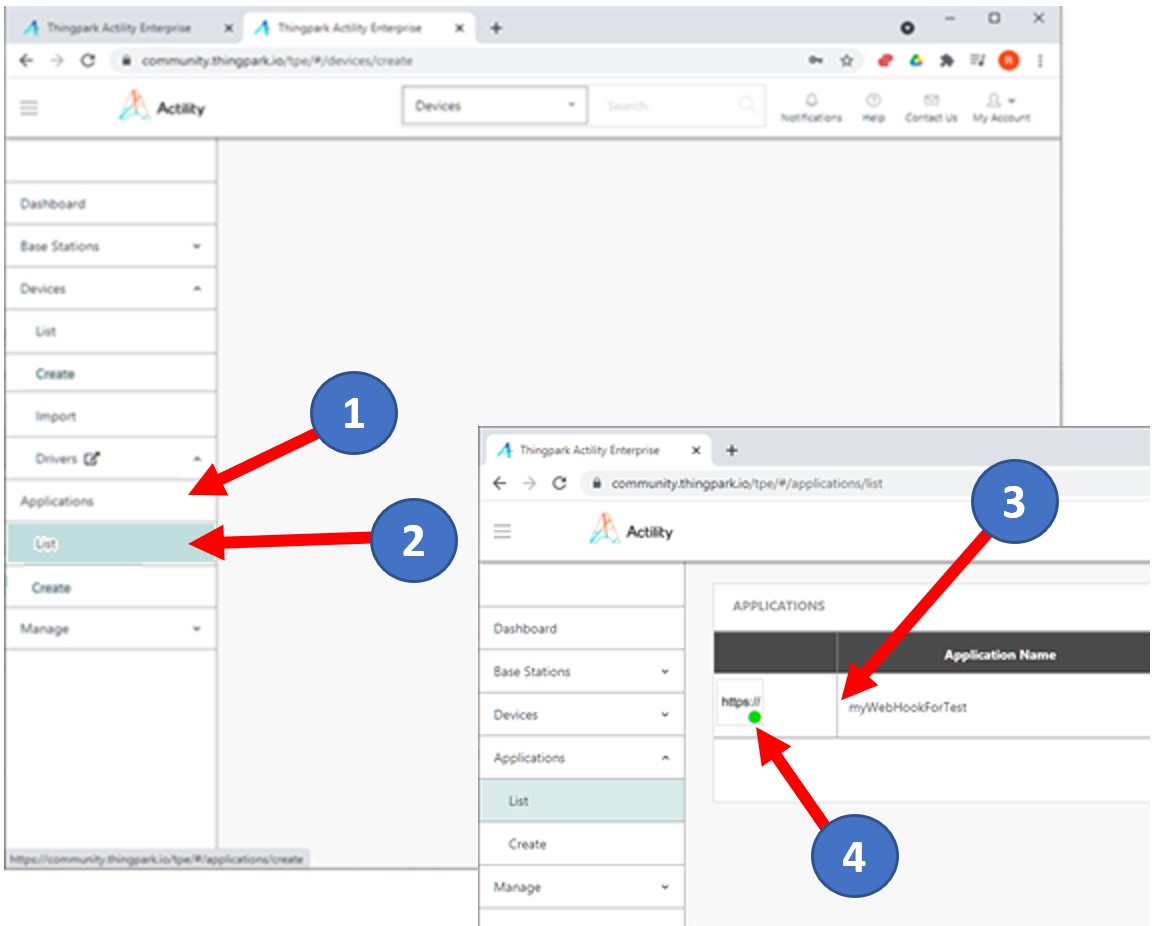
At this step, you will have a look at the application that you created and observe the data traffic .. You can access to Application information via Applications > List on the menu as shown below.
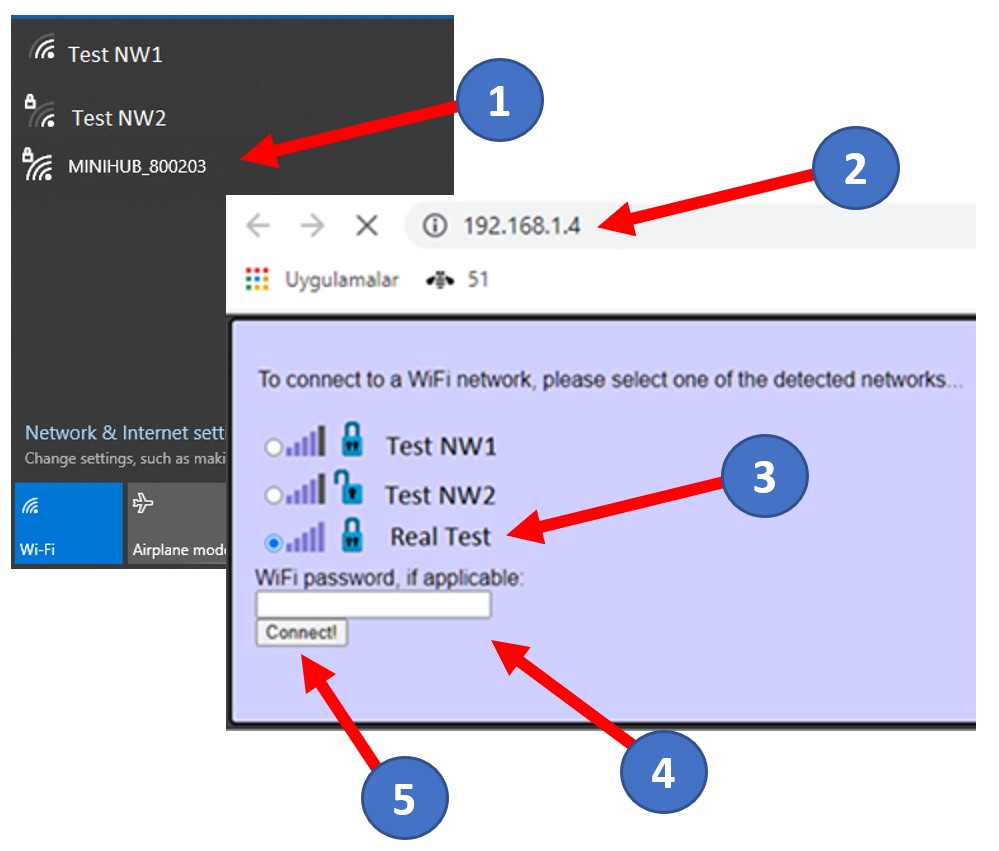
When successfully connected to WiFi Network you selected, following screen will be shown and MiniHub- Gateway will reboot automatically. i.e you wont be able to access to Gateway via web browser again. Access to Gateway is only possible on AP Mode (i.e. Config Mode)
In the Last 25 Packets Section, you can monitor the data packets that had been forwarded to backend application